LLM SERVING / BENCHMARK REPORT

Gemma-4-31B vLLM 서빙 PoC 벤치마크 상세 결과

Gemma-4-31B 모델을 vLLM으로 서빙하며 처리량, 기동 시간, 한국어 수용률을 측정한 PoC입니다. 실험은 EKS와 Karpenter 위에서 진행했습니다. L40S(g6e) 기준선 28조합에서 출발해 스타트업 단축 A/B, FP8과 한국어 speculative decoding 후속 실험을 지나 g7e(RTX PRO 6000 Blackwell) 본판정까지의 실측치를 정리합니다.

작성 기준일은 2026-08-09입니다.

실험 기간은 2026-08-05부터 2026-08-06까지입니다.

적용 대상은 Gemma-4-31B(NVFP4/FP8) 서빙, EKS와 Karpenter, g6e/g7e 인스턴스 세대입니다.

측정 도구는 vLLM v0.26.0의 vllm bench serve입니다.

요약

01배경과 판정 기준

이 절은 이번 측정을 왜 했고, 어떤 결과가 나오면 성공으로 볼지 정리합니다. 판정 기준을 먼저 정해 두어야 뒤의 수치를 같은 잣대로 읽을 수 있습니다.

이 PoC의 질문은 하나입니다. Gemma-4-31B를 vLLM으로 서빙할 때 GPU당 처리량이 현행 대비 1.5배 이상 나오는지입니다. vLLM은 대규모 언어 모델을 API 서비스 형태로 돌리는 오픈소스 서빙 엔진입니다.

처리량이 1.5배가 되면 같은 트래픽을 더 적은 서버로 감당할 수 있습니다. 그러면 서빙 레플리카를 12개에서 8개로 줄이는 근거가 됩니다. 판정 대상은 채팅, 요약, 분류, 장문 RAG 네 가지 실사용형 워크로드입니다.

측정은 두 단계로 진행했습니다. 먼저 확보가 쉬운 L40S(g6e) 위에서 기준선을 잡고, 서빙 파이프라인의 병목인 스타트업, 양자화 포맷, 한국어 지연을 정리했습니다. 양자화는 모델 가중치를 낮은 정밀도 숫자로 줄여 메모리와 연산을 아끼는 기법입니다.

그다음 FP4 텐서코어를 네이티브로 갖춘 g7e(RTX PRO 6000 Blackwell)를 Spot으로 확보해 본판정을 냈습니다. Spot은 클라우드의 남는 용량을 할인가에 빌리는 방식입니다.

지표는 네 가지를 봅니다. 처리량은 output tok/s(초당 생성 토큰 수)와 req/s(초당 처리 요청 수)로 잽니다. 지연은 TTFT(첫 토큰이 나올 때까지 걸리는 시간)와 ITL(토큰과 토큰 사이 간격)로 잽니다.

참고 - 판정 기준의 미완 항목

판정식의 분모인 당근 현행 GPU당 처리량 수치는 아직 입력되지 않았습니다. 따라서 이 문서의 배율은 L40S 기준선 대비 g7e의 상대 배율이며, 현행 대비 최종 배율은 그 값이 확보되면 확정됩니다.

02실험 환경과 방법

이 절은 실험을 돌린 장비와 측정 방법을 설명합니다. 뒤에 나오는 모든 수치는 여기서 정한 조건 위에서 읽어야 합니다.

서울 리전 EKS 클러스터(GPU01)의 serving 네임스페이스에 vLLM v0.26.0을 배포했습니다. EKS는 AWS의 관리형 Kubernetes 서비스이고, GPU 노드 확보는 자동 프로비저너인 Karpenter가 맡습니다. 모델 가중치는 S3 버킷에서 runai_streamer로 직접 적재했는데, 이는 가중치 파일을 S3에서 GPU로 병렬 스트리밍하는 vLLM 로더입니다.

인스턴스는 세 가지 세대를 용도에 맞게 나눠 썼습니다. 표 1에서는 각 인스턴스의 GPU 사양과 어떤 실험에 썼는지를 봅니다.

표 1. 실험에 사용한 인스턴스 세대와 용도
인스턴스GPU메모리와 NIC용도
g6e.2xlarge1x L40S 48GB (SM89, Ada)GDDR6 / 20Gbps 버스트L40S 기준선, 스타트업 A/B
g6e.12xlarge4x L40S 48GBGDDR6 / 100Gbps, NVMe RAID0FP8과 NVFP4 동시 비교, 스케일업
g7e.2xlarge1x RTX PRO 6000 Blackwell 96GBGDDR7 1.6TB/s / 50GbpsFP4 네이티브 본판정

2.1 워크로드 정의

네 시나리오는 입력 길이와 출력 길이로 실사용 패턴을 모사합니다. 각 시나리오를 동시성 1, 2, 4, 8, 16, 32, 64로 바꿔 가며 재서 시나리오당 7조합, 전체 28조합을 vllm bench serve로 측정했습니다. 프리필은 입력 프롬프트를 한꺼번에 읽어 들이는 첫 단계를 가리킵니다.

표 2에서는 각 시나리오의 입력/출력 토큰 길이와 그것이 흉내 내는 실제 작업을 봅니다.

표 2. 벤치마크 시나리오 정의
시나리오입력 / 출력 토큰모사 워크로드
S1_chat256 / 128CS와 짧은 채팅
S2_summary1,024 / 256게시글 요약과 생성
S3_moderation512 / 16분류와 모더레이션, 프리필 중심
S4_rag4,096 / 256장문 RAG
참고 - 양자화 포맷별 커널 경로

NVFP4는 4비트, FP8은 8비트 부동소수점 양자화 포맷입니다. 같은 NVFP4 가중치라도 GPU 세대에 따라 실행 커널이 다릅니다. L40S(SM89)는 FP4 텐서코어가 없어 NVFP4가 Marlin W4A16 커널로 자동 폴백(대체 실행)되고, g7e(Blackwell)는 FlashInferCutlassNvFp4 네이티브로 돕니다. FP8 W8A8은 L40S에서도 Ada FP8 텐서코어로 네이티브 실행이며 폴백이 아닙니다.

03L40S 기준선 28조합

이 절은 기존 세대 GPU인 L40S에서 잰 출발점 수치를 다룹니다. 뒤에서 g7e가 얼마나 빨라졌는지 계산할 때 이 값이 분모가 됩니다.

측정 조건은 nvidia/Gemma-4-31B-IT-NVFP4, 8K 컨텍스트, KV 캐시 31,344 tokens, speculative decoding 끔입니다. KV 캐시는 앞서 처리한 문맥의 중간 계산을 담아 두는 GPU 메모리 영역이고, 이 용량이 동시 처리 한도를 정합니다. speculative decoding은 작은 모델이 미리 추측한 토큰을 본 모델이 한 번에 검증하는 가속 기법인데, 이 라운드에서는 껐습니다.

첫 질문은 각 시나리오가 최대 몇 tok/s까지 나오는가입니다. 표 3에서는 시나리오별 최대 처리량과 그 최대가 나온 동시성 지점을 봅니다.

표 3. L40S 시나리오별 최대 output 처리량
시나리오최대 output tok/sreq/s최대 지점 동시성
S1_chat536.04.1964
S2_summary226.00.8832
S3_moderation81.75.118
S4_rag98.60.3932

S1 채팅의 동시성 곡선을 펼치면 포화 구조가 드러납니다. 처리량은 동시성 64까지 계속 오릅니다. 그러나 첫 토큰 지연(TTFT)은 동시성 32를 넘어서며 급격히 나빠집니다.

짧은 입력과 출력이라 KV 압박이 가장 덜한 시나리오인데도 그렇습니다. 표 4에서는 동시성을 올릴 때 처리량과 지연이 어느 지점에서 갈라지는지를 봅니다.

표 4. L40S S1_chat 동시성 곡선 (입력 256 / 출력 128)
동시성req/soutput tok/sTTFT p50 (ms)ITL p50 (ms)
10.1721.6110.645.2
20.3342.6102.946.5
40.6482.0143.647.1
81.22155.8169.648.1
162.22284.2296.649.7
323.17405.71,860.356.1
644.19536.02,677.466.6
주의 - 기준선은 g7e 판정치가 아닙니다

이 표의 값은 L40S에서 NVFP4가 Marlin W4A16으로 폴백 실행된 결과입니다. FP4 네이티브인 g7e 판정과 직접 비교하면 안 됩니다. 6절의 배율 계산에서 분모로만 씁니다. 또한 이 라운드는 수집 스크립트 버그로 GPU 사용률 컬럼이 기록되지 않았습니다.

04스타트업 단축 A/B

이 절은 서버가 켜져서 요청을 받기까지 걸리는 시간, 즉 스타트업을 어디까지 줄일 수 있는지 다룹니다. 새 GPU 노드가 뜰 때마다 반복되는 비용이라 운영에서 체감이 큰 항목입니다.

먼저 콜드 스타트(캐시가 전혀 없는 첫 기동) 537초(8분 57초)를 단계별로 분해했습니다. 가중치 로드 149초, torch.compile 73초, 신규 노드 확보 48초, 이미지 pull 82초입니다. torch.compile은 모델 실행 코드를 첫 기동 때 최적화 컴파일하는 단계입니다.

구성을 바꿔가며 이 병목을 어디까지 줄일 수 있는지 측정했습니다. 측정 구간은 pod 생성부터 /health 200 도달까지이고, 구간 분해는 vLLM 기동 로그 기준입니다(vLLM v0.26.0, 2026-08-05~06 수동 계측).

비교 기준선은 당근 현행 경로입니다. HuggingFace → S3 sync → S3 Mountpoint 위에서 runai_streamer(concurrency 32, memory_limit 8GiB)로 로드하는 구성입니다. Mountpoint는 S3 버킷을 파일시스템처럼 마운트해 주는 FUSE 도구입니다.

이 경로의 기동 시간은 이미 16분에서 5분까지 개선된 상태였습니다. 이번 실측은 같은 경로의 병목을 구간별로 확인하고 구성만 바꿔 재측정한 것입니다.

4.1 구성별 A/B - g6e.2xlarge

어떤 구성이 몇 초를 아끼는지가 질문입니다. 표 5에서는 구성별 총 기동 시간과, 그중 가중치 로드와 torch.compile이 차지하는 몫을 봅니다.

표 5. 구성별 기동 시간 (pod 생성부터 /health OK까지)
구성총 기동가중치 로드torch.compile
콜드 기준 (Mountpoint, 캐시 없음)537초149초73초
콜드 + hostPath 캐시 볼륨 (적재 회차)475초148초63초
웜 + compile 캐시 히트285초149초8.4초
웜 + runai_streamer S3 직결238초32초64초
웜 + runai + 캐시 히트 (최적)155초29초8.5초
콜드 기준 537초
compile 캐시 웜 285초
runai + 캐시 최적 155초
그림 1. 스타트업 단축 단계. 최적 구성은 당근 현행 기동 5분(300초) 대비 48% 짧습니다.

가장 큰 효과는 가중치 로드 경로 교체에서 나왔습니다. Mountpoint FUSE는 149초(실효 1.75Gbps)가 걸렸습니다. 반면 runai_streamer S3 직결은 29초에서 32초(실효 8.2Gbps, concurrency 64, memory_limit 24GiB)로 약 5배 빠릅니다.

compile 캐시를 노드에 영속화하면 재기동 시 컴파일이 73초에서 8.5초로 줄어 55초를 공짜로 회수합니다. 엔진 초기화도 93초에서 25초로 줄어듭니다.

flowchart LR S3[("S3 버킷 가중치")] -->|"Mountpoint FUSE 149초"| V["vLLM 엔진"] S3 -->|"runai_streamer 직결 29초"| V V --> API["OpenAI 호환 API"] API --> B["vllm bench serve"]
그림 2. 가중치 적재 경로 비교. 병목은 대역폭이 아니라 FUSE 경로였고, S3 직결로 우회하면 노드 NIC이 새 한계가 됩니다.
참고 - sleep 모드로 유휴 GPU 반납

sleep 모드는 놀고 있는 서버의 GPU 메모리를 잠시 반납해 두는 vLLM 기능입니다. 유휴 시 /sleep으로 26.8초 만에 GPU 메모리 45.4GB에서 14.7GB로 30GB를 반납하고, 수요가 오면 /wake_up으로 3.6초에 복귀했습니다. 155초 풀 재기동 대비 약 40배 빠른 복귀라, 자동 GPU 할당의 구조적 대안이 됩니다.

4.2 인스턴스 / 스토리지 축 - 12xlarge NVMe와 g7e

같은 runai_streamer 직결이라도 인스턴스와 스토리지에 따라 로드 시간이 더 내려갑니다. 가중치 로드만 보면 Mountpoint 149초 → 2xlarge 직결 29~32초 → 12xlarge 19초 → g7e 18초의 계열입니다. NVMe는 노드에 직접 붙은 고속 로컬 SSD를 말합니다.

  • g6e.12xlarge (100Gbps, NVMe RAID0) - 가중치 로드 19초. FP8과 NVFP4 두 모델(합계 66GB)을 같은 노드에서 동시에 로드하는 중에도 이 값이었고, Mountpoint 대비 7.8배입니다. 콜드 스타트(신규 노드 확보 + 이미지 pull + 로딩)는 2모델 동시 기준 380초였습니다. Karpenter NodePool에 instanceStorePolicy: RAID0 한 줄만 넣으면 인스턴스 스토어 3.8TB가 자동 구성됩니다. runai는 concurrency 128 / memory_limit 64GiB를 사용했습니다.
  • g7e.2xlarge (Spot) - 6절 본판정 환경에서 가중치 로드 18초였습니다. 로딩 구간 분해는 g6e 계열에서만 수행했으므로 g7e는 가중치 로드 단일 값입니다.

4.3 한계

  • 콜드 스타트는 재현 비용이 커서 반복 측정하지 못했습니다. 신규 노드에는 compile 캐시가 없으므로, 최적 구성의 콜드 기동 약 4.5분은 추정치입니다.
  • concurrency 값이 인스턴스와 함께 바뀌어(32 → 64 → 128) 단독 효과를 분리하지 못했습니다.
  • NVMe 프리스테이징 후 로컬 로드, fastsafetensors + GDS, FSx for Lustre, EBS 스냅샷 FSR, S3 Express One Zone은 미측정 대안으로 남아 있습니다.

05후속 실험: FP8, 스케일업, 한국어 draft

이 절은 기준선 이후에 남은 세 가지 질문을 실험으로 확인합니다. 양자화 포맷은 무엇이 나은지, 더 큰 인스턴스가 얼마나 이득인지, 한국어 응답을 빠르게 할 초안(draft) 모델은 무엇인지입니다.

5.1 FP8-dynamic 대 NVFP4

g6e.12xlarge 한 노드에 FP8 pod와 NVFP4 pod를 GPU 격리로 동시에 올려 같은 조건에서 비교했습니다. 결론은 워크로드에 따라 갈립니다. 초저지연 채팅은 NVFP4가, 요약과 RAG 같은 고동시성 종합 워크로드는 FP8에 fp8 KV를 켠 구성이 앞섭니다.

fp8 KV는 KV 캐시 자체도 8비트로 저장해 같은 메모리에 더 긴 문맥을 담는 옵션입니다. 표 6에서는 시나리오와 동시성 조합별로 어느 포맷이 이겼는지를 봅니다.

표 6. FP8-dynamic과 NVFP4(Marlin) 처리량 비교 (output tok/s)
시나리오 / 동시성FP8 (BF16 KV)FP8 (fp8 KV)NVFP4 (Marlin)승자
S1_chat / 8129.8-146.4NVFP4
S1_chat / 32321.5-411.1NVFP4
S2_summary / 32112.1201.8195.8FP8 + fp8 KV
S3_moderation / 8, 3270.4 / 95.9-57.3 / 75.8FP8
S4_rag / 3252.2104.592.4FP8 + fp8 KV
주의 - FP8 체크포인트는 fp8 KV를 명시해야 합니다

FP8-dynamic 체크포인트는 kv_cache_schemeNone이라 기본 KV가 BF16으로 잡힙니다. 그래서 고동시성에서 KV 부족으로 실력을 못 냅니다. --kv-cache-dtype fp8을 붙이면 KV 용량이 12,150에서 23,320 tokens로 늘어 S2와 S4에서 NVFP4를 역전합니다. 이 플래그를 빠뜨린 채 FP8이 느리다고 판단하는 것이 가장 흔한 실수입니다.

5.2 g6e.12xlarge 스케일업

더 큰 인스턴스는 로딩을 얼마나 앞당길까가 질문입니다. 100Gbps NIC과 NVMe RAID0를 갖춘 12xlarge에서는 runai_streamer 가중치 로드가 두 모델(66GB)을 동시에 올리는 중에도 19초로 끝났습니다. Mountpoint 149초 대비 7.8배입니다.

설정도 간단합니다. instanceStorePolicy: RAID0 한 줄로 NVMe 3.8TB가 kubelet ephemeral-storage로 자동 구성됩니다.

5.3 한국어 speculative decoding

speculative decoding에서는 작은 draft 모델이 토큰을 미리 추측하고 본 모델이 한 번에 검증합니다. 추측이 검증을 통과하는 비율이 수용률이고, 수용률이 높을수록 응답이 빨라집니다. 당근형 한국어 프롬프트 200개로 draft 모델별 수용률을 측정했습니다.

공식 MTP speculator인 google/gemma-4-31B-it-assistant수용률 56%로, 축소 어휘(32K vocab) EAGLE3의 5.6% 대비 10배 높았습니다. MTP는 본 모델에 붙여 여러 토큰을 한 번에 예측하게 하는 공식 초안 모듈입니다. 전체 262K vocab을 그대로 쓰기 때문에 한국어를 커버합니다.

표 7에서는 구성별 수용률과 함께 동시성 1(c1)과 8(c8)에서의 속도 변화를 봅니다. E2E p50은 요청 시작부터 응답 완료까지 걸린 시간의 중앙값입니다.

표 7. 한국어 speculative decoding 구성별 수용률과 지연 (FP8 타깃)
구성수용률c1 tok/sc1 E2E p50c8 tok/s
baseline (spec off)-18.46.85초122.9
ngram (k=4)25.8~27.5%20.16.70초131.4
MTP assistant (k=4)54.7~56.0%48.52.69초281.5

MTP assistant는 c1 종단 지연을 6.85초에서 2.69초로 2.6배, c8 처리량을 122.9에서 281.5 tok/s로 2.3배 개선합니다. 모델 크기도 0.94GB로 EAGLE3(4.5GB)의 5분의 1입니다. 한국어 draft는 별도 학습 없이 공식 MTP assistant 채택이 정답이라는 결론입니다.

06g7e 본판정

이 절이 이 문서의 본판정입니다. FP4 연산을 하드웨어로 직접 실행하는 신형 g7e에서 같은 벤치마크를 다시 돌려 L40S 기준선과 비교합니다.

Spot으로 확보한 g7e.2xlarge에서 NVFP4를 네이티브 커널로 돌렸습니다. KV 캐시가 125,023 tokens까지 잡히고 가중치 로드는 18초입니다. 동일 워크로드, 동일 8K 컨텍스트로 L40S 기준선과 비교한 결과 전 시나리오에서 3.49배에서 4.83배 높았습니다.

표 8에서는 시나리오별 최대 처리량의 배율과, 시간당 가격까지 반영한 비용 효율 배율을 봅니다.

표 8. g7e 대 L40S 최대 처리량과 비용 효율
시나리오L40S 최대g7e 최대처리량 배율비용효율 배율
S1_chat536 tok/s1,871 tok/s (14.6 req/s)3.49x6.4x
S2_summary226 tok/s910 tok/s (3.6 req/s)4.03x7.4x
S3_moderation81.7 tok/s395 tok/s (24.7 req/s)4.83x8.9x
S4_rag98.6 tok/s402 tok/s (1.6 req/s)4.08x7.5x

핵심: g7e의 우위는 고동시성에서 커집니다. preemption은 KV 캐시가 모자랄 때 진행 중인 요청을 중단했다가 다시 계산하는 동작입니다. 96GB GDDR7이 KV를 125,023 tokens까지 확보해 L40S가 포화하던 구간의 preemption을 없애기 때문입니다.

  • 디코드 지연 ITL p50이 전 시나리오 동시성 1 기준 45ms에서 25ms로 반토막입니다. GDDR7 1.6TB/s 대역폭과 FP4 네이티브 커널의 효과입니다.
  • 분류(S3)는 4.83배로 격차가 가장 큽니다. L40S에서 KV 부족으로 요동치던 동시성 16에서 32 구간이 g7e에서 24.7 req/s로 완전히 해소됐습니다.
  • 낮은 동시성의 레이턴시 구간에서도 전 조합 최소 1.8배로 일관된 우위를 보입니다.
참고 - 비용 효율 계산의 전제

비용효율 배율은 최대 tok/s를 시간당 단가로 나눈 값의 비율입니다. g7e는 Spot $1.50/hr, L40S는 온디맨드 $2.76/hr을 적용했습니다. g7e 온디맨드는 $4.13/hr이므로 Spot 확보 여부가 비용 효율의 큰 변수입니다.

07권장 프로덕션 구성

이 절은 앞 실험들의 결론을 지금 바로 적용할 수 있는 하나의 실행 명령으로 합칩니다. 각 옵션이 어느 실험에서 왔는지는 4절과 5절에서 확인할 수 있습니다.

L40S 환경 기준으로 후속 실험 결과를 합치면 다음 구성이 종합 성능과 한국어 지연을 동시에 잡습니다. FP8-dynamic 체크포인트에 fp8 KV와 MTP assistant를 얹습니다. 기동은 runai_streamer와 compile 캐시로 단축합니다.

권장 서빙 구성 (vLLM v0.26.0, L40S 기준)
vllm serve <FP8-dynamic 체크포인트> \
  --load-format runai_streamer \
  --model-loader-extra-config '{"concurrency":64,"memory_limit":25769803776}' \
  --kv-cache-dtype fp8 \
  --speculative-config '{"method":"mtp","model":"<gemma-4-31B-it-assistant>","num_speculative_tokens":4}' \
  --tool-call-parser gemma4 --reasoning-parser gemma4 --enable-auto-tool-choice
# 추가: VLLM_CACHE_ROOT 영속화(compile 캐시), Pod Identity(S3 read)

이 조합에서 무엇을 기대할 수 있을까요. 예상 효과는 웜 기동 2분에서 3분, 한국어 응답 지연 2.5배 단축, 프리필 처리량 약 1.25배입니다. g7e를 확보하면 같은 구성을 NVFP4 네이티브로 재판정해 6절의 배율을 다시 검증합니다.

08결론과 남은 과제

마지막으로 전체 결과를 판정 기준에 대입하고, 아직 확인하지 못한 항목을 정리합니다. 한 문장으로 요약하면, g7e로 옮기는 것만으로 처리량 3.5배 이상과 비용 효율 6배 이상을 얻고 기동 시간과 한국어 지연 문제도 함께 풀린다는 것입니다.

처리량 관점에서 g7e는 L40S 대비 3.5배에서 4.8배, 비용 효율은 6배에서 9배입니다. PoC 판정 기준인 1.5배를 크게 상회합니다.

따라서 당근 현행 GPU가 L40S급 이하라면 레플리카 12개에서 8개를 넘어 4개 수준까지 검토할 여지가 있습니다. 스타트업과 한국어 지연도 각각 실용 범위로 들어왔습니다. 표 9에서는 운영 상황별로 어떤 구성을 고르면 되는지를 봅니다.

표 9. 상황별 권장 구성
운영 상황권장
초저지연 채팅 위주NVFP4, 디코드 ITL이 가장 낮음
요약과 RAG 등 종합 워크로드FP8 + fp8 KV
한국어 지연이 중요MTP assistant speculator (수용률 56%)
기동 시간 단축runai_streamer S3 직결 + compile 캐시 영속화
최대 처리량과 비용 효율g7e Spot, NVFP4 네이티브

남은 과제는 세 가지입니다.

  • 첫째, 판정식을 닫으려면 당근 현행 GPU당 처리량 수치가 필요합니다.
  • 둘째, MTP와 fp8 KV, 고동시성의 상호작용 스윕(num_speculative_tokens 4 대 8)이 미완입니다.
  • 셋째, 70B급을 대비한 TP=2/4(PCIe) 실측이 남아 있습니다. TP는 한 모델을 여러 GPU에 나눠 싣는 텐서 병렬화입니다.
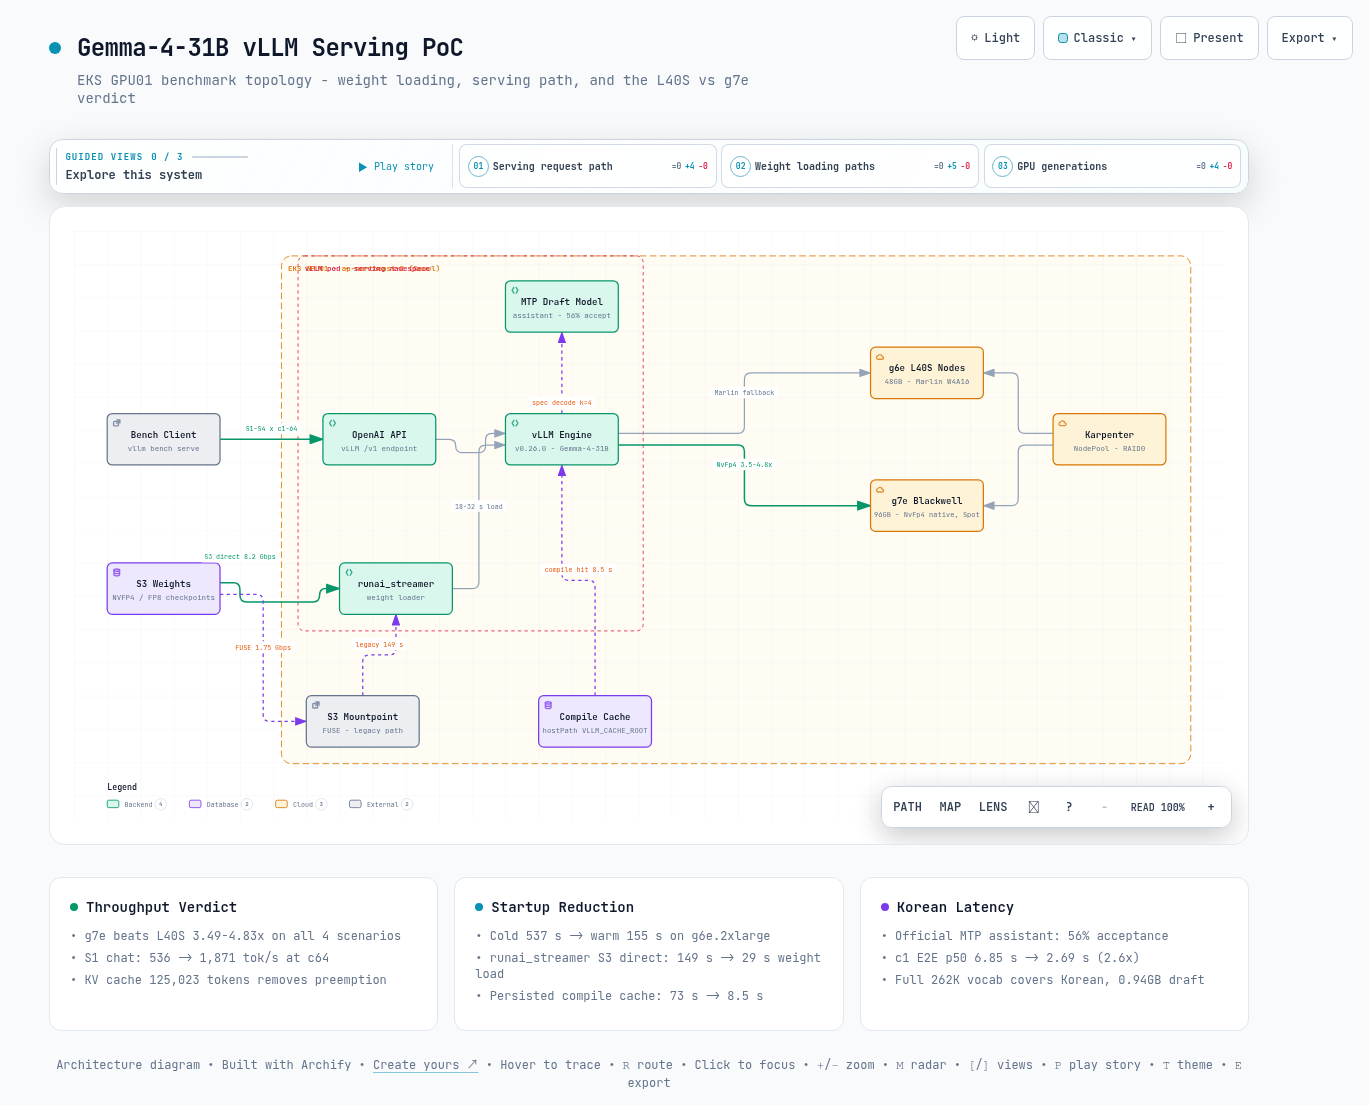
인터랙티브 아키텍처 맵 전체 이미지 - 시스템 구성 요소와 흐름을 한 화면으로 보여줍니다
그림 3. 인터랙티브 아키텍처 맵 전체 보기. 이미지를 클릭하면 노드 탐색, 경로 추적, 다크/라이트 테마를 지원하는 인터랙티브 버전 ↗이 열립니다.

--참고 자료

실측 원본

  • GPU01 벤치마크 결과 아카이브 (28조합 + g7e 28조합, ENV 포함) - 자체 실측 (2026-08-05 ~ 2026-08-06) results/SUMMARY.md, results/STARTUP.md, results/FOLLOWUP.md, results/G7E-JUDGMENT.md

공식 문서

LLM SERVING / BENCHMARK REPORT

Gemma-4-31B vLLM Serving PoC Benchmark: Detailed Results

A PoC serving the Gemma-4-31B model with vLLM, measuring throughput, startup time, and Korean acceptance rate. The experiments ran on EKS and Karpenter. Starting from a 28-combination baseline on L40S (g6e), it walks through the startup-reduction A/B tests and the follow-up experiments on FP8 and Korean speculative decoding, all the way to the final verdict on g7e (RTX PRO 6000 Blackwell).

This report is written as of 2026-08-09.

The experiments ran from 2026-08-05 to 2026-08-06.

It covers Gemma-4-31B (NVFP4/FP8) serving, EKS with Karpenter, and the g6e/g7e instance generations.

The measurement tool is vllm bench serve from vLLM v0.26.0.

Summary

01Background and Success Criteria

This section explains why the measurements were made and what outcome counts as success. Fixing the pass criteria first lets every number that follows be read against the same yardstick.

This PoC asks a single question. Does serving Gemma-4-31B with vLLM deliver 1.5x or more throughput per GPU versus the current setup? vLLM is an open-source serving engine that runs large language models as an API service.

At 1.5x throughput, the same traffic can be handled with fewer servers. That justifies shrinking the serving fleet from 12 replicas to 8. The verdict covers four realistic workloads: chat, summarization, moderation, and long-context RAG.

Measurement proceeded in two stages. First, a baseline was established on L40S (g6e), which is easy to procure, and the serving-pipeline bottlenecks were worked through: startup, quantization format, and Korean latency. Quantization is the technique of storing model weights in lower-precision numbers to save memory and compute.

Then g7e (RTX PRO 6000 Blackwell), which has native FP4 tensor cores, was secured as Spot capacity for the final verdict. Spot means renting the cloud's spare capacity at a discount.

Four metrics are used. Throughput is reported as output tok/s (generated tokens per second) and req/s (requests per second). Latency is reported as TTFT (time until the first token appears) and ITL (the gap between consecutive tokens).

Note - An open item in the success criteria

The denominator of the pass formula, Karrot's current per-GPU throughput, has not been provided yet. The ratios in this document are therefore g7e relative to the L40S baseline; the final ratio against the current production setup will be fixed once that number is available.

02Test Environment and Method

This section describes the hardware the experiments ran on and how they were measured. Every number that follows should be read against the conditions fixed here.

vLLM v0.26.0 was deployed to the serving namespace of an EKS cluster (GPU01) in the Seoul region. EKS is AWS's managed Kubernetes service, and GPU nodes are provisioned automatically by Karpenter. Model weights were loaded directly from an S3 bucket with runai_streamer, a vLLM loader that streams weight files from S3 to the GPU in parallel.

Three instance generations were used, each for a distinct purpose. Table 1 shows each instance's GPU specification and which experiment it served.

Table 1. Instance generations used in the experiments
InstanceGPUMemory and NICPurpose
g6e.2xlarge1x L40S 48GB (SM89, Ada)GDDR6 / 20Gbps burstL40S baseline, startup A/B
g6e.12xlarge4x L40S 48GBGDDR6 / 100Gbps, NVMe RAID0FP8 vs NVFP4 side by side, scale-up
g7e.2xlarge1x RTX PRO 6000 Blackwell 96GBGDDR7 1.6TB/s / 50GbpsFP4-native final verdict

2.1 Workload definitions

The four scenarios model real usage patterns through input and output lengths. Each scenario was swept across concurrency 1, 2, 4, 8, 16, 32, and 64, giving 7 combinations per scenario and 28 in total, measured with vllm bench serve. Prefill refers to the first phase, where the input prompt is read in all at once.

Table 2 shows each scenario's input/output token lengths and the real task it imitates.

Table 2. Benchmark scenario definitions
ScenarioInput / output tokensModeled workload
S1_chat256 / 128CS and short chat
S2_summary1,024 / 256Post summarization and generation
S3_moderation512 / 16Classification and moderation, prefill-heavy
S4_rag4,096 / 256Long-context RAG
Note - Kernel paths per quantization format

NVFP4 is a 4-bit and FP8 an 8-bit floating-point quantization format. The same NVFP4 weights execute on different kernels depending on GPU generation. L40S (SM89) has no FP4 tensor cores, so NVFP4 automatically falls back to the Marlin W4A16 kernel (a substitute path), while g7e (Blackwell) runs it natively with FlashInferCutlassNvFp4. FP8 W8A8 runs natively on L40S too, on Ada FP8 tensor cores, and is not a fallback.

03L40S Baseline: 28 Combinations

This section covers the starting-point numbers measured on the previous-generation L40S GPU. These values become the denominator later, when computing how much faster g7e is.

The conditions were nvidia/Gemma-4-31B-IT-NVFP4, an 8K context, a KV cache of 31,344 tokens, and speculative decoding off. The KV cache is the GPU memory area that stores intermediate results for the context processed so far, and its size sets the concurrency ceiling. Speculative decoding, a speed-up where a small model guesses tokens ahead and the main model verifies them in one pass, was disabled in this round.

The first question is how many tok/s each scenario reaches at its peak. Table 3 shows peak throughput per scenario and the concurrency at which it occurs.

Table 3. L40S peak output throughput per scenario
ScenarioPeak output tok/sreq/sConcurrency at peak
S1_chat536.04.1964
S2_summary226.00.8832
S3_moderation81.75.118
S4_rag98.60.3932

Unrolling the S1 chat concurrency curve exposes the saturation pattern. Throughput keeps climbing up to concurrency 64. First-token latency (TTFT), however, degrades sharply past concurrency 32.

This happens even though short inputs and outputs make it the scenario with the least KV pressure. Table 4 shows where throughput and latency part ways as concurrency rises.

Table 4. L40S S1_chat concurrency curve (input 256 / output 128)
Concurrencyreq/soutput tok/sTTFT p50 (ms)ITL p50 (ms)
10.1721.6110.645.2
20.3342.6102.946.5
40.6482.0143.647.1
81.22155.8169.648.1
162.22284.2296.649.7
323.17405.71,860.356.1
644.19536.02,677.466.6
Warning - The baseline is not the g7e verdict

The values in this table come from NVFP4 running on L40S through the Marlin W4A16 fallback. They must not be compared directly with the FP4-native g7e verdict. They serve only as the denominator in the ratio calculations of Section 6. Also, a collection-script bug in this round left the GPU utilization column unrecorded.

04Startup Reduction A/B

This section asks how far startup, the time from launching a server to it accepting requests, can be pushed down. The cost repeats every time a new GPU node comes up, so it is keenly felt in operations.

First, the 537 s (8 min 57 s) cold start (a first boot with no caches at all) was broken into phases. Weight loading takes 149 s, torch.compile 73 s, new-node provisioning 48 s, and image pull 82 s. torch.compile is the phase that optimizes and compiles the model's execution code on first boot.

Configurations were varied to see how far each bottleneck could be pushed down. The measured window runs from pod creation to /health returning 200, and the phase breakdown follows the vLLM startup logs (vLLM v0.26.0, manually instrumented on 2026-08-05 to 06).

The comparison baseline is Karrot's current path: HuggingFace → S3 sync → loading with runai_streamer (concurrency 32, memory_limit 8GiB) on top of S3 Mountpoint. Mountpoint is a FUSE tool that mounts an S3 bucket like a filesystem.

That path's startup time had already improved from 16 minutes to 5. This round verified the bottlenecks of the same path phase by phase and re-measured with only the configuration changed.

4.1 Per-configuration A/B - g6e.2xlarge

The question is which configuration saves how many seconds. Table 5 shows total startup time per configuration and the share taken by weight loading and torch.compile.

Table 5. Startup time per configuration (pod creation to /health OK)
ConfigurationTotal startupWeight loadtorch.compile
Cold baseline (Mountpoint, no cache)537 s149 s73 s
Cold + hostPath cache volume (populating run)475 s148 s63 s
Warm + compile cache hit285 s149 s8.4 s
Warm + runai_streamer direct to S3238 s32 s64 s
Warm + runai + cache hit (best)155 s29 s8.5 s
Cold baseline 537 s
Warm compile cache 285 s
runai + cache, best 155 s
Figure 1. Startup reduction stages. The best configuration is 48% shorter than Karrot's current 5-minute (300 s) startup.

The biggest gain came from replacing the weight-loading path. Mountpoint FUSE took 149 s (effective 1.75Gbps). By contrast, runai_streamer direct to S3 took 29 to 32 s (effective 8.2Gbps, concurrency 64, memory_limit 24GiB), about 5x faster.

Persisting the compile cache on the node cuts compilation from 73 s to 8.5 s on restart, reclaiming 55 s for free. Engine initialization also drops from 93 s to 25 s.

flowchart LR S3[("S3 bucket weights")] -->|"Mountpoint FUSE 149 s"| V["vLLM engine"] S3 -->|"runai_streamer direct 29 s"| V V --> API["OpenAI-compatible API"] API --> B["vllm bench serve"]
Figure 2. Weight-loading path comparison. The bottleneck was the FUSE path, not bandwidth; bypassing it with a direct S3 connection makes the node NIC the new limit.
Note - Returning idle GPU memory with sleep mode

Sleep mode is a vLLM feature that temporarily hands back the GPU memory of an idle server. When idle, /sleep released 30GB of GPU memory (45.4GB down to 14.7GB) in 26.8 s, and /wake_up restored it in 3.6 s when demand returned. That is roughly 40x faster than the 155 s full restart, making it a structural alternative to automatic GPU allocation.

4.2 Instance / storage axis - 12xlarge NVMe and g7e

Even with the same runai_streamer direct connection, load time keeps dropping with instance and storage. Looking at weight load alone, the series is Mountpoint 149 s → 2xlarge direct 29-32 s → 12xlarge 19 s → g7e 18 s. NVMe means fast local SSDs attached directly to the node.

  • g6e.12xlarge (100Gbps, NVMe RAID0) - weight load 19 s. This held even while loading two models (FP8 and NVFP4, 66GB combined) on the same node at once, 7.8x faster than Mountpoint. Cold start (new node provisioning + image pull + loading) was 380 s with both models. A single instanceStorePolicy: RAID0 line in the Karpenter NodePool auto-configures 3.8TB of instance store. runai used concurrency 128 / memory_limit 64GiB.
  • g7e.2xlarge (Spot) - weight load was 18 s in the Section 6 verdict environment. The load-phase breakdown was performed only on the g6e family, so g7e has a single weight-load value.

4.3 Limitations

  • Cold starts are expensive to reproduce and were not measured repeatedly. A new node has no compile cache, so the best configuration's cold startup of about 4.5 minutes is an estimate.
  • concurrency changed together with the instance (32 → 64 → 128), so its standalone effect could not be isolated.
  • NVMe pre-staging with local load, fastsafetensors + GDS, FSx for Lustre, EBS snapshot FSR, and S3 Express One Zone remain unmeasured alternatives.

05Follow-ups: FP8, Scale-up, Korean Draft

This section answers three questions left open after the baseline. Which quantization format is better, how much does a larger instance help, and which draft model should speed up Korean responses?

5.1 FP8-dynamic vs NVFP4

An FP8 pod and an NVFP4 pod were run side by side on one g6e.12xlarge node with GPU isolation, compared under identical conditions. The conclusion depends on the workload. NVFP4 wins for ultra-low-latency chat, while FP8 with fp8 KV enabled wins for high-concurrency mixed workloads like summarization and RAG.

fp8 KV is an option that stores the KV cache itself in 8 bits, fitting more context into the same memory. Table 6 shows which format won for each scenario and concurrency combination.

Table 6. FP8-dynamic vs NVFP4 (Marlin) throughput comparison (output tok/s)
Scenario / concurrencyFP8 (BF16 KV)FP8 (fp8 KV)NVFP4 (Marlin)Winner
S1_chat / 8129.8-146.4NVFP4
S1_chat / 32321.5-411.1NVFP4
S2_summary / 32112.1201.8195.8FP8 + fp8 KV
S3_moderation / 8, 3270.4 / 95.9-57.3 / 75.8FP8
S4_rag / 3252.2104.592.4FP8 + fp8 KV
Warning - FP8 checkpoints need fp8 KV set explicitly

FP8-dynamic checkpoints ship with kv_cache_scheme set to None, so the KV cache defaults to BF16. The model then underperforms at high concurrency for lack of KV space. Adding --kv-cache-dtype fp8 grows KV capacity from 12,150 to 23,320 tokens, and FP8 overtakes NVFP4 on S2 and S4. Judging FP8 as slow while missing this flag is the most common mistake.

5.2 g6e.12xlarge scale-up

The question is how much a larger instance speeds up loading. On the 12xlarge with a 100Gbps NIC and NVMe RAID0, runai_streamer finished loading weights in 19 s even while bringing up two models (66GB) at once, 7.8x faster than Mountpoint's 149 s.

Setup is simple too. A single instanceStorePolicy: RAID0 line auto-configures 3.8TB of NVMe as kubelet ephemeral-storage.

5.3 Korean speculative decoding

In speculative decoding, a small draft model guesses tokens ahead and the main model verifies them in one pass. The share of guesses that pass verification is the acceptance rate, and higher acceptance means faster responses. Draft-model acceptance was measured with 200 Karrot-style Korean prompts.

The official MTP speculator, google/gemma-4-31B-it-assistant, reached 56% acceptance, 10x higher than the 5.6% of the reduced-vocabulary (32K vocab) EAGLE3. MTP is the official drafting module attached to the main model to predict several tokens at once. It covers Korean because it keeps the full 262K vocabulary.

Table 7 shows acceptance per configuration together with the speed change at concurrency 1 (c1) and 8 (c8). E2E p50 is the median time from request start to response completion.

Table 7. Korean speculative decoding: acceptance and latency per configuration (FP8 target)
ConfigurationAcceptancec1 tok/sc1 E2E p50c8 tok/s
baseline (spec off)-18.46.85 s122.9
ngram (k=4)25.8-27.5%20.16.70 s131.4
MTP assistant (k=4)54.7-56.0%48.52.69 s281.5

The MTP assistant improves c1 end-to-end latency from 6.85 s to 2.69 s (2.6x) and c8 throughput from 122.9 to 281.5 tok/s (2.3x). The model is also small at 0.94GB, one fifth of EAGLE3 (4.5GB). The conclusion: for a Korean draft, adopting the official MTP assistant with no extra training is the right answer.

06Final Verdict on g7e

This section is the document's final verdict. The same benchmark was re-run on the newer g7e, which executes FP4 math directly in hardware, and compared against the L40S baseline.

NVFP4 ran on native kernels on a Spot g7e.2xlarge. The KV cache reaches 125,023 tokens and weights load in 18 s. Compared against the L40S baseline on the same workloads and the same 8K context, g7e came out 3.49x to 4.83x higher across every scenario.

Table 8 shows the peak-throughput ratio per scenario, plus the cost-efficiency ratio once hourly price is factored in.

Table 8. g7e vs L40S: peak throughput and cost efficiency
ScenarioL40S peakg7e peakThroughput ratioCost-efficiency ratio
S1_chat536 tok/s1,871 tok/s (14.6 req/s)3.49x6.4x
S2_summary226 tok/s910 tok/s (3.6 req/s)4.03x7.4x
S3_moderation81.7 tok/s395 tok/s (24.7 req/s)4.83x8.9x
S4_rag98.6 tok/s402 tok/s (1.6 req/s)4.08x7.5x

Key point: the g7e advantage widens at high concurrency. Preemption is what happens when the KV cache runs short: an in-flight request is stopped and recomputed. 96GB of GDDR7 holds up to 125,023 KV tokens and removes that preemption in the range where L40S used to saturate.

  • Decode latency ITL p50 halves from 45ms to 25ms at concurrency 1 across all scenarios, the effect of 1.6TB/s GDDR7 bandwidth and native FP4 kernels.
  • Moderation (S3) shows the widest gap at 4.83x. The concurrency 16-to-32 range that thrashed on L40S from KV shortage is fully resolved on g7e at 24.7 req/s.
  • Even in the low-concurrency latency range, g7e leads consistently at a minimum of 1.8x across all combinations.
Note - Assumptions behind the cost-efficiency figures

The cost-efficiency ratio divides peak tok/s by the hourly price and compares the results. g7e uses Spot at $1.50/hr; L40S uses on-demand at $2.76/hr. g7e on-demand is $4.13/hr, so Spot availability is the big variable in cost efficiency.

07Recommended Production Configuration

This section folds the conclusions of the preceding experiments into one command you can apply right away. Sections 4 and 5 show which experiment each option came from.

Combining the follow-up results on the L40S environment, the following configuration captures both overall performance and Korean latency. It puts fp8 KV and the MTP assistant on top of an FP8-dynamic checkpoint. Startup is shortened by runai_streamer and the compile cache.

Recommended serving configuration (vLLM v0.26.0, on L40S)
vllm serve <FP8-dynamic checkpoint> \
  --load-format runai_streamer \
  --model-loader-extra-config '{"concurrency":64,"memory_limit":25769803776}' \
  --kv-cache-dtype fp8 \
  --speculative-config '{"method":"mtp","model":"<gemma-4-31B-it-assistant>","num_speculative_tokens":4}' \
  --tool-call-parser gemma4 --reasoning-parser gemma4 --enable-auto-tool-choice
# Additionally: persist VLLM_CACHE_ROOT (compile cache), Pod Identity (S3 read)

What should this combination deliver? The expected effect is a warm startup of 2 to 3 minutes, Korean response latency cut 2.5x, and prefill throughput of about 1.25x. Once g7e is secured, the same configuration is re-verified with native NVFP4 to re-validate the ratios of Section 6.

08Conclusion and Remaining Work

Finally, the overall results are placed against the pass criteria, along with the items still to be confirmed. To sum up in one sentence: moving to g7e alone brings 3.5x or more throughput and 6x or more cost efficiency, and it resolves the startup-time and Korean-latency problems along the way.

On throughput, g7e is 3.5x to 4.8x over L40S, and 6x to 9x on cost efficiency. It clears the PoC pass bar of 1.5x by a wide margin.

So if Karrot's current GPUs are at L40S level or below, there is room to consider going beyond 12-to-8 replicas, down to around 4. Startup and Korean latency have each moved into practical range as well. Table 9 shows which configuration to pick for each operating situation.

Table 9. Recommended configuration per situation
Operating situationRecommendation
Ultra-low-latency chat firstNVFP4, lowest decode ITL
Mixed workloads such as summarization and RAGFP8 + fp8 KV
Korean latency mattersMTP assistant speculator (56% acceptance)
Shorter startup timerunai_streamer direct to S3 + persisted compile cache
Maximum throughput and cost efficiencyg7e Spot, native NVFP4

Three items remain.

  • First, closing the pass formula requires Karrot's current per-GPU throughput number.
  • Second, the interaction sweep of MTP, fp8 KV, and high concurrency (num_speculative_tokens 4 vs 8) is unfinished.
  • Third, TP=2/4 (PCIe) measurements in preparation for 70B-class models are still to be done. TP is tensor parallelism, splitting one model across several GPUs.
Full image of the interactive architecture map showing the system components and flows in one view
Figure 3. Full view of the interactive architecture map. Click the image to open the interactive version ↗ with node search, route tracing, and dark/light themes.

--References

Raw measurements

  • GPU01 benchmark result archive (28 combinations + 28 g7e combinations, ENV included) - in-house measurements (2026-08-05 to 2026-08-06) results/SUMMARY.md, results/STARTUP.md, results/FOLLOWUP.md, results/G7E-JUDGMENT.md

Official documentation