AMAZON EC2 / FEATURE VERIFICATION

EC2에 애플리케이션 계층 상태 검사가 생겼다 - Application Status Checks 실측 검증

2026-08-10 출시된 Amazon EC2 Application Status Checks를 처음 접하는 독자 기준으로 소개합니다. 테스트 ASG에 장애를 주입해 감지부터 자동 교체까지의 타임라인을 실측하고, 문서와 다르거나 문서에 없는 지점 6건을 함께 기록했습니다.

작성 기준일은 2026-08-13입니다.

적용 대상은 EC2 인스턴스 위에서 HTTP/HTTPS 응답을 내는 애플리케이션을 운영하는 워크로드입니다.

검증 환경은 ap-northeast-2 리전의 t4g.micro 테스트 ASG 2대와 로컬 인스턴스입니다.

주 출처는 EC2 공식 문서, AWS What's New(2026-08-10), 그리고 2026-08-13 실측 데이터입니다.

요금은 관리형 ENI당 시간당 $0.01(AZ별)에 CloudWatch 표준 요금이 더해지는 구조입니다.

요약

01기능 소개

EC2 인스턴스의 상태 검사(status check)는 지금까지 system과 instance 2종이었습니다. 이 둘은 인스턴스 자체가 살아 있는지까지만 확인하고, 그 위에서 도는 애플리케이션이 실제로 응답하는지는 보지 못했습니다. 2026-08-10 출시된 Application Status Checks는 이 빈자리를 채우는 세 번째, 애플리케이션 계층의 상태 검사입니다.

동작 원리는 단순합니다. AWS가 60초마다 지정한 포트와 경로로 HTTP 또는 HTTPS 요청을 보내고, 응답 코드를 status code matcher와 비교합니다. 연속 2회 실패하면 impaired(장애), 실패 후 연속 2회 성공하면 회복으로 판정합니다(임계값은 설정 가능, 주기 60초는 고정입니다).

AWS What's New(2026-08-10)가 드는 대표적인 사용 사례는 웹 서버 무응답과 Docker 데몬 미실행 감지입니다. 모든 상용 리전과 GovCloud(US)에서 사용할 수 있습니다.

1.1 기본 설정값

파라미터를 지정하지 않으면 어떤 값으로 동작할까요? 아래 표는 공식 문서 Default settings의 기본값입니다. 이 검증에서는 파라미터 9종을 생략하고 만든 체크가 실제로 이 값들로 동작하는지도 뒤에서 확인합니다.

표 1. Application Status Checks 기본 설정값 (공식 문서 Default settings)
항목기본값비고
체크 주기60초고정, 변경 불가
실패 임계값연속 2회설정 가능
성공 임계값연속 2회설정 가능
Timeout6초범위 1~30초, 강제 타임아웃
status code matcher200기대 응답 코드
HTTP 경로/
IP 버전ipv4체크당 1개, IPv4/IPv6 둘 다 보려면 체크 2개
IP scopeprivate
Device index0
초기화 grace300초범위 1~600초
aggregationincluded1.3에서 설명

이 중 운영에서 특히 주의할 값은 초기화 grace입니다. 공식 문서는 grace가 짧으면 애플리케이션이 준비되기 전에 ASG가 신규 인스턴스를 교체할 수 있다고 경고합니다.

1.2 체크는 어디서 오나 - 관리형 ENI

체크 요청의 발신지는 어디일까요? EC2 application status checks 서비스가 대상 VPC 안에 관리형 ENI(AWS가 만들고 관리하는 네트워크 인터페이스)를 생성하고 여기서 요청을 보냅니다. 트래픽은 대상 인스턴스와 같은 AZ의 AWS 관리 인스턴스에서 출발해 AWS 내부 네트워크로만 이동합니다(퍼블릭 인터넷 미경유).

  • ENI는 소스 서브넷과 SG 조합당 1개씩 만들어집니다. 조합이 처음 필요할 때 생성되고, 더 이상 필요 없으면 제거됩니다.
  • 관리형 ENI는 인스턴스의 ENI 한도에는 계산되지 않지만, 계정의 리전당 네트워크 인터페이스 쿼터(AZ별 집행)에는 계산됩니다.
  • 요금은 관리형 ENI당 시간당 $0.01(AZ별)이고, CloudWatch 표준 요금이 별도로 붙습니다.
  • ENI 생성은 서비스 연결 역할(EC2ApplicationStatusChecksServiceRolePolicy)이 수행하므로 IAM 설정이 따로 필요 없습니다.

온보딩 방식은 2가지입니다. 기본은 AWS 관리형 네트워크 경로로, --health-check-paths를 생략하면 AWS가 소스/대상 서브넷과 SG를 알아서 고릅니다. 엄격한 세그멘테이션이나 컴플라이언스 요건이 있으면 customer-managed 모드로 경로를 직접 지정할 수 있습니다.

참고 - HTTPS 인증서, 재부팅, Local Zones

HTTPS 체크는 서버 인증서를 검증하지 않습니다. 재부팅 중에는 체크가 실패로 보고됩니다. Local Zones에서는 ENI가 부모 리전에 위치하고 서비스 링크를 경유하므로 추가 데이터 전송 요금이 발생할 수 있습니다.

1.3 상태 값 체계와 aggregation

체크 결과는 두 층위로 보고됩니다. 개별 체크의 상태와, 인스턴스 전체(overall)의 상태입니다.

  • 개별 체크 5종: passed, failed, initializing, insufficient-data, not-applicable
  • 인스턴스 전체 6종: ok, impaired, initializing, insufficient-data, not-applicable(모든 체크가 excluded일 때), suppressed

개별 체크가 전체 상태에 반영될지는 aggregation 설정이 정합니다. included(기본)는 전체 상태에 기여하고 ASG가 사용합니다. excluded는 개별 평가와 보고는 지속하되 전체 상태에 기여하지 않아, 프로덕션에서 신규 체크를 검증할 때 씁니다.

suppression은 인스턴스 단위의 일시 억제 수단입니다. duration을 지정하거나 무기한으로 걸 수 있고, 억제 중 전체 상태는 suppressed가 되며 ASG는 조치하지 않습니다. 공식 문서는 배포 전 훅에서 걸고 배포 후 훅에서 푸는 패턴을 안내합니다.

1.4 ASG 통합

이 기능의 실질 가치는 Auto Scaling Group(ASG) 통합에서 나옵니다. included 체크 기준으로 전체 상태가 impaired가 되면 ASG가 해당 인스턴스를 자동으로 종료하고 교체합니다. ASG 쪽 추가 설정은 필요 없고, 체크를 그룹 인스턴스에 연결하기만 하면 됩니다.

그룹 전체 연결은 시스템 태그로 합니다. aws:autoscaling:groupName 태그를 연결 대상으로 지정합니다. 실측에서는 이후 만들어지는 교체 인스턴스도 추가 API 호출 없이 체크에 편입되는 것을 확인했습니다(3.2 참조). ASG는 전체 상태만 사용하므로 excluded 체크와 suppressed 상태는 조치 대상이 아닙니다.

1.5 쿼터

얼마나 많이 만들 수 있을까요? 공식 문서 기준 쿼터는 다음과 같습니다.

  • 계정당 체크 50개, 체크당 연결 50개, 계정당 연결 200개(자동 승인 조정)입니다.
  • 계정당 타깃 5,000개(수동 승인)입니다. 타깃은 인스턴스와 체크의 페어를 뜻합니다.
  • 쿼터를 초과한 타깃은 모니터링되지 않고 상태도 보고되지 않습니다. 문서는 쿼터 사용량에 CloudWatch 알람 설정을 권장합니다.

02테스트 방법

문서를 읽는 것과 동작을 직접 보는 것은 다릅니다. 이 검증은 ap-northeast-2 리전에 테스트 전용 ASG(t4g.micro, AL2023 arm64, 2대)를 프라이빗 서브넷 2개에 걸쳐 만들고, 기본값 확인용 로컬 인스턴스 1대를 더해 진행했습니다(aws-cli 2.36.22).

체크는 2개를 만들었습니다. 로컬용 체크는 설정 파라미터 9종을 일부러 생략해, 서버가 실제로 적용하는 값이 표 1의 문서 기본값과 일치하는지 확인하는 용도입니다. ASG용 체크는 초기화 grace를 90초로 줄이고 aws:autoscaling:groupName 태그로 그룹 전체에 연결했습니다.

2.1 헬스 shim - systemd 상태를 HTTP로 변환

체크가 바라볼 대상으로는 Python 표준 라이브러리 HTTP 서버(0.0.0.0:8080)를 헬스 shim으로 세웠습니다. shim은 /health 요청을 받으면 더미 데몬(demo-daemon.service)의 systemd 상태를 조회해 active면 200, 아니면 503을 반환합니다. systemd 상태를 HTTP 응답 코드로 바꿔주는 간단한 변환 레이어이고, ASG 노드에는 user data로 부팅 시 자동 배치됩니다.

더미 데몬에는 Restart=always를 걸었습니다. 의도적인 설계입니다. 크래시성 장애는 systemd가 초 단위로 되살리고, 재시작으로 복구되지 않는 지속 장애만 shim이 503으로 노출합니다. 이렇게 하면 장애 대응이 세 계층으로 분리되는지를 그대로 관찰할 수 있습니다.

장애 주입은 원격 엔드포인트 2개로 합니다. /breaksystemctl stop으로 데몬을 세우는데, 명시적 정지에는 Restart=always가 발동하지 않으므로 지속 장애가 재현됩니다. /fix는 데몬을 되살리며, 두 엔드포인트는 SG로 제어 인스턴스에서만 접근을 허용했습니다.

flowchart LR F["장애 발생"] --> L1["1계층: systemd Restart=always, 초 단위 자가 복구"] L1 -- "재시작으로 복구 안 되는 지속 장애" --> L2["2계층: Application Status Check, 연속 2회 실패 시 impaired"] L2 -- "overall impaired" --> L3["3계층: ASG 인스턴스 종료 후 교체"]
그림 1. 검증 환경의 3계층 복구 구조. 크래시는 1계층에서 초 단위로 흡수되고, 재시작으로 복구되지 않는 지속 장애만 체크의 impaired 판정을 거쳐 ASG 교체까지 올라가도록 설계했습니다.

2.2 체크 생성과 연결

체크 생성과 연결은 CLI 두 번이면 끝납니다. --health-check-paths를 생략해 AWS 관리형 네트워크 경로를 쓰고, ASG 연결은 1.4에서 설명한 시스템 태그 방식을 사용했습니다.

코드 1. 체크 생성과 ASG 태그 연결
# 생성 - AWS 관리형 경로 (--health-check-paths 생략)
aws ec2 create-application-status-check \
  --protocol http --port 8080 --path "/health" \
  --status-code-matcher "200" \
  --initialization-grace-period-seconds 90

# 연결 - ASG 시스템 태그로 그룹 전체를 한 번에
aws ec2 associate-application-status-check \
  --application-status-check-id asc-xxxx \
  --target-tag-associations Key=aws:autoscaling:groupName,Value=my-asg

2.3 검증 수단

판정 근거는 1개 레이어에 의존하지 않고 4개 레이어로 교차 확인했습니다.

  • 20초 간격 상태 폴러 로그 380건 - 체크와 인스턴스 상태의 전이 시각을 기록합니다.
  • tcpdump 캡처 - 체크 트래픽의 실제 프로토콜과 발신 IP를 패킷 수준에서 확인합니다.
  • CloudTrail - 관리형 ENI 생성 등 서비스 측 API 호출을 추적합니다.
  • ASG 활동 이력 - 종료와 교체의 시각, Cause 문자열을 확보합니다.

작성 전에 보고서의 주장 15건을 독립 재검증 절차로 다시 확인해 9건은 확증, 6건은 부분 확증으로 정정했습니다. 본문에는 정정을 반영한 값을 실었습니다.

03실측 결과

결과는 네 갈래로 정리합니다. 임계값 2회의 실제 모습, 장애 주입부터 교체까지의 타임라인, 체크에 잡히지 않는 장애, 그리고 suppression과 excluded의 동작입니다.

3.1 임계값 2회는 이렇게 움직입니다

연속 2회 실패라는 규칙은 API 응답에서 어떻게 보일까요? 1회째 실패에서는 Reason만 503 응답을 담은 값으로 바뀌고 Status는 passed로 유지됩니다. 2회째 실패에서 비로소 failed와 impaired로 전이합니다.

회복도 대칭입니다. 연속 2회 성공의 2회째에 passed와 ok로 돌아오며, 회복 소요는 실측 2분 24초였습니다. 이 패턴은 에피소드 3개에서 동일하게 재현됐습니다.

1.1에서 예고한 기본값 검증 결과도 여기에 둡니다. 파라미터 9종을 생략하고 만든 체크의 서버 적용값은 표 1의 문서 기본값과 전 항목 일치했습니다. 다만 status code matcher 200은 생성 시 명시적으로 전달한 값이라, 생략 시 기본 200이라는 항목만은 문서 근거로 남습니다.

3.2 핵심 타임라인 - 주입부터 완전 복구까지 약 8.5분

이 검증의 중심 질문입니다. 장애가 나면 얼마 만에 새 인스턴스로 교체될까요? ASG 노드 1대에 /break를 주입하고 폴러 로그와 ASG 활동 이력의 시각을 맞춰본 결과가 아래 표입니다(시각은 UTC).

표 2. 장애 주입 → 자동 교체 실측 타임라인 (초기화 grace 90초 설정)
이벤트 시각 주입 후 경과
/break 주입 (systemctl stop)12:13:490초
overall impaired 판정 (연속 2회 실패)-약 2분
ASG 종료 개시12:18:595분 10초
교체 노드 Pending → initializing--
교체 노드 ok, 완전 복구12:22:13약 8.5분

impaired 확정과 종료 개시 사이의 약 3분은 ASG가 상태를 확인하고 조치하는 구간입니다. 교체 노드는 시스템 태그 연결 덕에 추가 API 호출 없이 자동으로 체크에 편입됐습니다. ASG 활동 이력에 남은 종료 사유는 아래 원문 그대로입니다.

ASG 활동 이력 - 종료 Cause 원문
At 2026-08-13T12:18:59Z an instance was taken out of service in response to an EC2 Application Status check failure.

3.3 체크에 잡히지 않는 장애 - kill -9

반대로 체크에 아예 보이지 않는 장애도 있습니다. kill -9로 데몬 프로세스를 죽이자 systemd가 7초 안에 재기동했고, 60초 주기 체크의 어떤 평가에도 흔적이 남지 않았습니다(이후 3분간 전부 passed). 그림 1의 계층 분리가 의도대로 동작해, 크래시성 장애는 1계층에서 끝나고 체크까지 올라가지 않습니다.

shim 자체를 세웠을 때는 ConnectionRefused로 실패 처리됐습니다. 감시자가 죽으면 장애로 판정되는 fail-safe 방향입니다. 장애인데 Healthy로 판별되는 오류는 이번 검증에서 관찰되지 않았습니다.

3.4 suppression과 excluded의 실제 동작

suppression은 활성화가 즉시 반영되지 않았습니다. API 호출 후 overall이 suppressed로 바뀌기까지 약 3.2분이 걸렸고, 그동안은 실시간 평가 상태가 그대로 보였습니다. 해제도 약 2분 이상 지연됐습니다.

억제 중에 장애를 넣어도 개별 체크는 정상적으로 failed로 전이했습니다. overall만 suppressed로 마스킹을 유지해, 억제 중에는 ASG가 조치하지 않는다는 문서 설명과 부합합니다.

excluded 전환에서는 개별 체크가 계속 평가되어 passed(200)로 보고됐습니다. overall은 not-applicable로 바뀌었고, 체크별 CloudWatch 지표도 계속 발행됐습니다. 1.3에서 설명한 프로덕션 신규 체크 검증 용도가 실제로 성립하는 동작입니다.

04문서와 실측의 간극

출시 첫 주의 기능답게, 문서와 실제 동작이 다르거나 운영에 필요한 정보가 문서에 없는 지점이 6건 나왔습니다. 기능 결함이라기보다는 문서가 아직 따라가지 못한 영역입니다. 자동화 스크립트나 알람을 짤 때 걸리는 부분이므로, 각 항목의 문서 서술과 실측 결과를 표로 대조합니다.

표 3. 문서 서술과 실측 결과의 간극 6건 (2026-08-13 ap-northeast-2 실측)
항목 문서 서술 실측 결과
1. 연결 오류의 StatusCode ConnectionTimeout 등 연결 오류에는 StatusCodeProtocol 필드가 "not present" "StatusCode": 0 필드가 존재(연결 오류 278건 전수 확인). Protocol 생략만 문서대로
2. "HTTP/2 전송"의 실체 헬스체크 요청은 HTTP/2로 전송 HTTP/1.1 요청에 Upgrade: h2c로 HTTP/2 업그레이드를 제안(pcap 6건 전수 동일). HTTP/1.0으로만 응답하는 서버도 정상 평가
3. suppression 전파 지연 지연 언급 없음. 실패 시 suppressed로 표시된다는 뉘앙스 활성화 후 약 3.2분간 실시간 평가 상태가 그대로 노출. 앱이 건강해도 suppressed로 전환되고, 해제도 약 2분 이상 지연
4. 억제 중 CW 지표 미기재 집계 지표 StatusCheckFailed_Application은 발행 중단(알람이 INSUFFICIENT_DATA로 전이), 체크별 지표는 계속 발행
5. 관리형 ENI 조회 조회 방법 미기재 Operator.HiddenByDefault로 목록/필터 조회에서 숨김. CloudTrail의 CreateNetworkInterface 이벤트로 ID 확보 후 직접 지정 조회는 가능
6. 삭제 후 ENI 잔존 조합이 더 이상 필요 없으면 제거 체크 삭제 후 20분 이상 in-use로 잔존. 해당 SG 삭제가 DependencyViolation으로 차단됨

2번을 조금 더 풀면, 문서의 "HTTP/2로 전송"은 HTTP/2 강제가 아니라 업그레이드 제안이었습니다. 캡처된 요청의 User-Agent는 Java-http-client/25.0.4였고, 서버가 업그레이드를 무시하고 HTTP/1.0으로 응답해도 정상 평가됐습니다. 구형 앱 서버도 HTTP/2 지원 없이 그대로 쓸 수 있다는 뜻입니다.

5번에는 덧붙일 관찰이 하나 있습니다. 실제 체크 트래픽의 소스 IP(10.254.2.187)는 CloudTrail로 확보한 관리형 ENI의 IP(10.254.2.162)와도 달랐습니다. 60초마다 0.73초 간격으로 요청 2개가 오는 패턴으로 미루어 이중화된 체커로 추정합니다. 이 부분은 추론입니다.

1번, 4번, 6번은 자동화 코드에 직접 영향을 줍니다. 어떻게 대응할지는 다음 섹션에서 우선순위를 붙여 정리합니다.

05운영 가이드

실측에서 확인한 동작을 기준으로 도입 절차와 운영 설계를 정리합니다. 1순위는 도입 절차입니다. 아래 경고의 루프는 절차만 지키면 피할 수 있고, 나머지 항목은 그 위에 얹는 보완 설계입니다.

주의 - SG를 확인하지 않으면 연쇄 교체 루프에 빠집니다

체크 트래픽의 SG 인바운드를 허용하지 않은 채 기존 ASG에 included로 연결하면, 신규 인스턴스가 부팅 → grace → 연속 2회 실패 → 종료를 반복합니다. 실측에서는 14분 동안 3세대에 걸쳐 총 5대가 교체됐습니다. 애플리케이션이 건강한데도 인스턴스가 계속 죽어 나가는 상황입니다.

도입 순서는 SG 인바운드 선확인 → excluded로 생성해 일부 인스턴스에서 2주기(약 2분) 이상 관찰 → describe-application-status로 기대 상태 확인 후 included 승격입니다. 이미 루프에 빠졌다면 체크를 excluded로 전환해 교체를 멈추고 SG부터 고칩니다.

5.1 운영 설계 체크리스트

도입 절차 다음은 운영 설계입니다. 네 가지 모두 4장의 간극에서 나온 항목입니다.

  1. 배포 훅의 suppression은 배포 3분 이상 전에 겁니다. 활성화 후 전파까지 약 3.2분이 걸리고, 그동안 실시간 평가 상태가 그대로 보입니다. 미전파 구간에서 ASG가 impaired에 반응하는지는 이번에 검증하지 못했으므로, 안전하게 3분 대기를 권장합니다.
  2. CloudWatch 알람은 이원으로 설계합니다. 집계 지표 StatusCheckFailed_Application은 억제 중 발행이 중단되므로, missing data 처리를 notBreaching으로 볼지 missing으로 둘지 의도적으로 선택해야 합니다. 억제와 무관한 관측이 필요하면 체크별 지표(StatusCheckFailed_Application_{asc-id})에 알람을 겁니다. describe API 표시는 서비스 타임스탬프보다 약 40~60초 늦게 관측됐으므로, 자동화는 지표 기반이 빠릅니다.
  3. Reason 파서는 Code 값으로 분기합니다. 연결 오류에도 "StatusCode": 0 필드가 존재하므로, 필드 부재를 전제로 짠 파서는 깨집니다. ConnectionTimeout, ConnectionRefused 등 Code 값으로 분기하는 쪽이 안전합니다.
  4. IaC 삭제 자동화에는 재시도 로직을 넣습니다. 체크 삭제 후에도 관리형 ENI가 20분 이상 in-use로 남아, 해당 SG 삭제를 DependencyViolation으로 차단합니다.

결론: 한 문장으로 요약하면, Application Status Checks는 상태 검사의 빈자리였던 애플리케이션 계층을 채우고 ASG 자동 교체까지 이어 주는 기능이며, 실측 기준 장애 감지에 약 2분, 완전 복구까지 약 8.5분이 걸립니다. SG 선확인과 excluded 관찰을 거쳐 included로 승격하고, suppression은 3분 이상 선행하고, 알람을 집계와 체크별 지표로 이원화하면 이번 실측에서 드러난 함정은 모두 설계 단계에서 피할 수 있습니다.
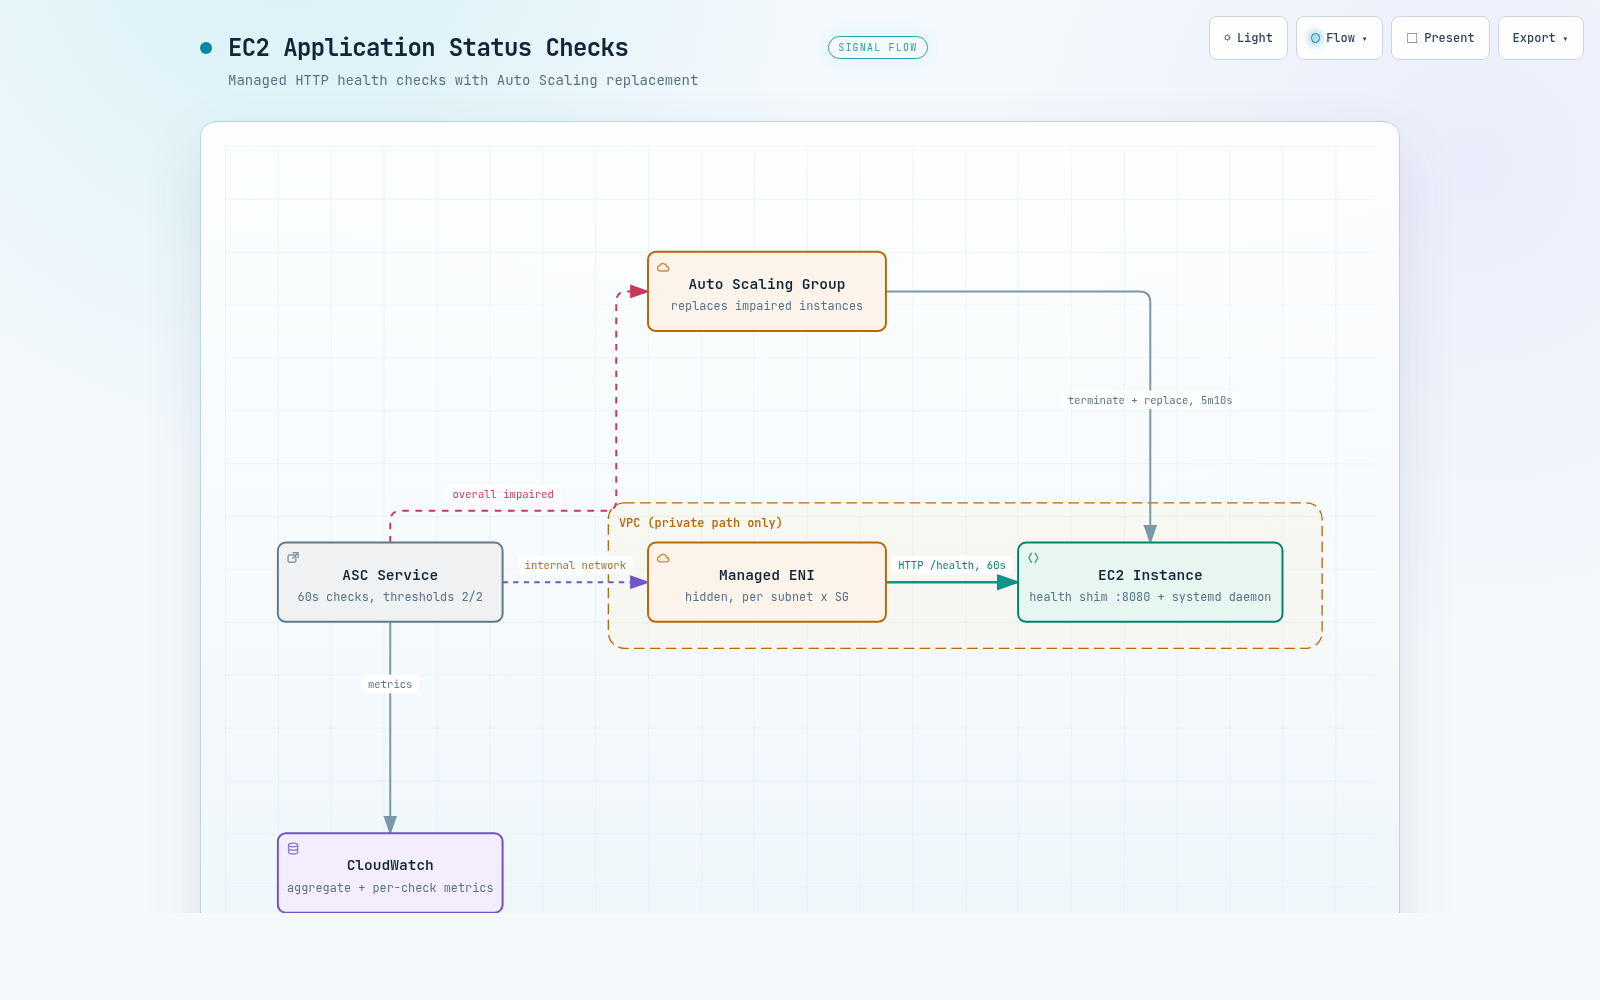
인터랙티브 아키텍처 맵 전체 이미지 - 관리형 ENI를 통한 60초 헬스체크 경로와 ASG 자동 교체 흐름
그림 2. 인터랙티브 아키텍처 맵 전체 보기. 이미지를 클릭하면 노드 탐색, 경로 추적, 다크/라이트 테마를 지원하는 인터랙티브 버전 ↗이 열립니다.

--참고 자료

핵심 출처

공식 문서

AMAZON EC2 / FEATURE VERIFICATION

EC2 Now Checks the Application Layer - Application Status Checks, Verified Hands-On

An introduction to Amazon EC2 Application Status Checks, released on 2026-08-10, written for readers encountering it for the first time. We injected failures into a test ASG to measure the timeline from detection to automatic replacement, and recorded 6 points that differ from or are missing in the documentation.

Written as of 2026-08-13.

This applies to workloads running applications that serve HTTP/HTTPS responses on EC2 instances.

The verification environment is a 2-instance t4g.micro test ASG in ap-northeast-2, plus a local instance.

Primary sources are the official EC2 documentation, AWS What's New (2026-08-10), and measured data from 2026-08-13.

Pricing is $0.01 per managed ENI per hour (per AZ), plus standard CloudWatch charges.

TL;DR

01Feature overview

Until now, EC2 instance status checks came in 2 kinds: system and instance. These only verify that the instance itself is alive; they cannot see whether the application running on top of it actually responds. Application Status Checks, released on 2026-08-10, fills this gap as the third, application-layer status check.

The mechanism is simple. AWS sends an HTTP or HTTPS request to the port and path you specify every 60 seconds and compares the response code against the status code matcher. 2 consecutive failures mean impaired; after a failure, 2 consecutive successes mean recovered (the thresholds are configurable; the 60-second interval is fixed).

The representative use cases cited by AWS What's New (2026-08-10) are detecting an unresponsive web server and a Docker daemon that is not running. It is available in all commercial regions and GovCloud (US).

1.1 Default settings

What values apply when you specify no parameters? The table below lists the defaults from the official documentation's Default settings. Later in this verification we also confirm whether a check created with 9 parameters omitted actually runs with these values.

Table 1. Application Status Checks default settings (official docs, Default settings)
ItemDefaultNotes
Check interval60sFixed, not configurable
Failure threshold2 consecutiveConfigurable
Success threshold2 consecutiveConfigurable
Timeout6sRange 1-30s, hard timeout
status code matcher200Expected response code
HTTP path/
IP versionipv41 per check; use 2 checks to cover both IPv4/IPv6
IP scopeprivate
Device index0
Initialization grace300sRange 1-600s
aggregationincludedExplained in 1.3

Of these, the value to watch most carefully in operations is the initialization grace. The official documentation warns that if the grace is too short, the ASG may replace new instances before the application is ready.

1.2 Where checks come from - managed ENIs

Where do check requests originate? The EC2 application status checks service creates managed ENIs (network interfaces created and managed by AWS) inside the target VPC and sends requests from them. Traffic departs from an AWS-managed instance in the same AZ as the target instance and travels only over the AWS internal network (never traversing the public internet).

  • One ENI is created per combination of source subnet and SG. It is created when the combination is first needed and removed when no longer needed.
  • Managed ENIs do not count against the instance's ENI limit, but they do count against the account's per-region network interface quota (enforced per AZ).
  • Pricing is $0.01 per managed ENI per hour (per AZ), with standard CloudWatch charges billed separately.
  • ENI creation is performed by a service-linked role (EC2ApplicationStatusChecksServiceRolePolicy), so no separate IAM setup is required.

There are 2 onboarding modes. The default is the AWS-managed network path: omit --health-check-paths and AWS picks the source/target subnets and SGs for you. If you have strict segmentation or compliance requirements, customer-managed mode lets you specify the paths yourself.

Note - HTTPS certificates, reboots, Local Zones

HTTPS checks do not validate the server certificate. During a reboot, checks are reported as failing. In Local Zones, the ENI resides in the parent region and traffic traverses the service link, which can incur additional data transfer charges.

1.3 Status values and aggregation

Check results are reported at two levels: the status of each individual check, and the overall status of the instance.

  • 5 individual check states: passed, failed, initializing, insufficient-data, not-applicable
  • 6 instance overall states: ok, impaired, initializing, insufficient-data, not-applicable (when every check is excluded), suppressed

Whether an individual check feeds into the overall status is decided by the aggregation setting. included (the default) contributes to the overall status and is what the ASG uses. excluded keeps evaluating and reporting individually but does not contribute to the overall status, which is what you use to validate a new check in production.

Suppression is a per-instance, temporary mute. You can set a duration or make it indefinite; while suppressed, the overall status becomes suppressed and the ASG takes no action. The official documentation describes the pattern of enabling it in a pre-deployment hook and releasing it in a post-deployment hook.

1.4 ASG integration

The practical value of this feature comes from the Auto Scaling Group (ASG) integration. When the overall status becomes impaired based on included checks, the ASG automatically terminates and replaces the instance. No extra configuration is needed on the ASG side; you only attach the check to the group's instances.

Group-wide attachment is done with a system tag: specify the aws:autoscaling:groupName tag as the association target. In our measurements, replacement instances created afterwards were enrolled into the check without any additional API calls (see 3.2). The ASG uses only the overall status, so excluded checks and the suppressed state are not acted upon.

1.5 Quotas

How many can you create? Per the official documentation, the quotas are as follows.

  • 50 checks per account, 50 associations per check, and 200 associations per account (auto-approved adjustment).
  • 5,000 targets per account (manual approval). A target means an instance-check pair.
  • Targets beyond the quota are not monitored and report no status. The docs recommend setting a CloudWatch alarm on quota usage.

02Test method

Reading the documentation and watching the behavior firsthand are different things. For this verification we built a dedicated test ASG (t4g.micro, AL2023 arm64, 2 instances) across 2 private subnets in ap-northeast-2, plus 1 local instance for default-value verification (aws-cli 2.36.22).

We created 2 checks. The check for the local instance deliberately omitted 9 configuration parameters, to confirm whether the values the server actually applies match the documented defaults in Table 1. The check for the ASG reduced the initialization grace to 90 seconds and was attached to the whole group via the aws:autoscaling:groupName tag.

2.1 Health shim - turning systemd state into HTTP

As the check's target we stood up a Python standard-library HTTP server (0.0.0.0:8080) as a health shim. When the shim receives a /health request, it queries the systemd state of a dummy daemon (demo-daemon.service) and returns 200 if active, 503 otherwise. It is a thin translation layer that converts systemd state into HTTP response codes, and it is deployed automatically at boot on the ASG nodes via user data.

The dummy daemon runs with Restart=always. This is a deliberate design. Crash-type failures are revived by systemd within seconds, and only persistent failures that a restart cannot fix are exposed as 503 by the shim. This lets us observe directly whether failure handling is separated into three layers.

Failure injection is done through 2 remote endpoints. /break stops the daemon with systemctl stop; since Restart=always does not trigger on an explicit stop, this reproduces a persistent failure. /fix revives the daemon, and both endpoints were restricted by SG to the control instance only.

flowchart LR F["Failure occurs"] --> L1["Layer 1: systemd Restart=always, self-heals in seconds"] L1 -- "Persistent failure a restart cannot fix" --> L2["Layer 2: Application Status Check, impaired after 2 consecutive failures"] L2 -- "overall impaired" --> L3["Layer 3: ASG terminates and replaces the instance"]
Figure 1. The three-layer recovery structure of the verification environment. Crashes are absorbed within seconds at layer 1, and only persistent failures that a restart cannot fix escalate through the check's impaired verdict up to ASG replacement.

2.2 Creating and attaching the check

Creating and attaching a check takes just two CLI calls. We omitted --health-check-paths to use the AWS-managed network path, and attached to the ASG with the system tag method described in 1.4.

Code 1. Creating the check and attaching via the ASG tag
# Create - AWS-managed path (omit --health-check-paths)
aws ec2 create-application-status-check \
  --protocol http --port 8080 --path "/health" \
  --status-code-matcher "200" \
  --initialization-grace-period-seconds 90

# Attach - the whole group at once via the ASG system tag
aws ec2 associate-application-status-check \
  --application-status-check-id asc-xxxx \
  --target-tag-associations Key=aws:autoscaling:groupName,Value=my-asg

2.3 Verification instruments

We did not rely on a single layer for our verdicts; we cross-checked across four layers.

  • 380 entries of a 20-second-interval status poller log - records the transition times of check and instance states.
  • tcpdump captures - confirm the check traffic's actual protocol and source IP at the packet level.
  • CloudTrail - traces service-side API calls such as managed ENI creation.
  • ASG activity history - captures termination/replacement timestamps and the Cause strings.

Before writing, we re-examined 15 of the report's claims through an independent re-verification pass: 9 were confirmed and 6 were corrected to partially confirmed. The values in this document reflect those corrections.

03Measured results

We organize the results into four strands: what the 2-consecutive threshold actually looks like, the timeline from failure injection to replacement, failures the check cannot see, and the behavior of suppression and excluded.

3.1 How the 2-consecutive threshold behaves

How does the 2-consecutive-failures rule appear in API responses? On the 1st failure, only Reason changes to a value carrying the 503 response, while Status stays passed. Only on the 2nd failure does it transition to failed and impaired.

Recovery is symmetric. On the 2nd of 2 consecutive successes it returns to passed and ok, and the measured recovery time was 2 minutes 24 seconds. This pattern reproduced identically across 3 episodes.

The default-value verification promised in 1.1 also belongs here. The server-applied values of the check created with 9 parameters omitted matched the documented defaults in Table 1 on every item. However, the status code matcher 200 was a value we passed explicitly at creation, so the claim that it defaults to 200 when omitted rests on the documentation alone.

3.2 Core timeline - about 8.5 minutes from injection to full recovery

This is the central question of this verification. When a failure occurs, how long until the instance is replaced with a new one? We injected /break into 1 ASG node and aligned the timestamps of the poller log with the ASG activity history; the result is the table below (times in UTC).

Table 2. Measured timeline from failure injection to automatic replacement (initialization grace set to 90s)
Event Time Elapsed since injection
/break injected (systemctl stop)12:13:490s
overall impaired verdict (2 consecutive failures)-approx. 2min
ASG termination start12:18:595min 10s
Replacement node Pending → initializing--
Replacement node ok, full recovery12:22:13approx. 8.5min

The roughly 3 minutes between the impaired verdict and termination start is the window in which the ASG confirms the status and takes action. Thanks to the system-tag association, the replacement node was enrolled into the check automatically, with no additional API calls. The termination cause recorded in the ASG activity history reads verbatim as follows.

ASG activity history - termination Cause, verbatim
At 2026-08-13T12:18:59Z an instance was taken out of service in response to an EC2 Application Status check failure.

3.3 Failures the check cannot see - kill -9

Conversely, some failures are entirely invisible to the check. When we killed the daemon process with kill -9, systemd restarted it within 7 seconds, and no trace appeared in any evaluation of the 60-second-interval check (all passed for the following 3 minutes). The layer separation of Figure 1 worked as intended: crash-type failures end at layer 1 and never climb up to the check.

When we stopped the shim itself, it was treated as a failure with ConnectionRefused. That is the fail-safe direction: if the watcher dies, it is judged a failure. No hole in the false-negative direction (a failure judged healthy) was observed in this verification.

3.4 How suppression and excluded actually behave

Suppression activation was not reflected immediately. It took about 3.2 minutes after the API call for the overall status to change to suppressed, and in the meantime the live evaluation state remained visible. Release was also delayed by about 2 minutes or more.

Even when we injected a failure while suppressed, the individual check transitioned to failed normally. Only the overall status kept the suppressed mask, consistent with the documentation's statement that the ASG takes no action while suppressed.

After switching to excluded, the individual check kept being evaluated and reported passed (200). The overall status changed to not-applicable, and per-check CloudWatch metrics continued to be published. This confirms in practice the production new-check validation use described in 1.3.

04Gaps between docs and measurements

As you might expect from a feature in its first week, we found 6 points where the documentation differs from actual behavior or is missing information needed for operations. These are less feature defects than areas the documentation has not yet caught up with. They matter when writing automation scripts or alarms, so the table below contrasts each item's documented statement with the measured result.

Table 3. 6 gaps between documented statements and measured results (measured 2026-08-13, ap-northeast-2)
Item Documented statement Measured result
1. StatusCode on connection errors For connection errors such as ConnectionTimeout, the StatusCode and Protocol fields are "not present" The "StatusCode": 0 field is present (confirmed across all 278 connection errors). Only the Protocol omission matches the docs
2. What "sent over HTTP/2" really is Health check requests are sent over HTTP/2 An HTTP/1.1 request proposing an HTTP/2 upgrade via Upgrade: h2c (identical across all 6 pcaps). A server responding only with HTTP/1.0 is still evaluated normally
3. Suppression propagation delay No delay mentioned. The nuance is that the status shows suppressed upon failure For about 3.2 minutes after activation, the live evaluation state stays exposed. It switches to suppressed even while the app is healthy, and release is also delayed by about 2+ minutes
4. CW metrics while suppressed Not documented The aggregate metric StatusCheckFailed_Application stops publishing (alarms transition to INSUFFICIENT_DATA); per-check metrics keep publishing
5. Looking up managed ENIs Lookup method not documented Hidden from list/filter queries via Operator.HiddenByDefault. After obtaining the ID from the CloudTrail CreateNetworkInterface event, direct lookup by ID is possible
6. ENI lingering after deletion Removed when the combination is no longer needed Remains in-use for 20+ minutes after check deletion. Deleting the associated SG is blocked with DependencyViolation

To unpack item 2 a little: the docs' "sent over HTTP/2" turned out to be an upgrade proposal, not forced HTTP/2. The captured requests' User-Agent was Java-http-client/25.0.4, and a server that ignored the upgrade and answered with HTTP/1.0 was still evaluated normally. This means legacy app servers can be used as-is, without HTTP/2 support.

Item 5 carries one additional observation. The source IP of the actual check traffic (10.254.2.187) also differed from the managed ENI's IP obtained via CloudTrail (10.254.2.162). Judging from the pattern of 2 requests arriving 0.73 seconds apart every 60 seconds, we presume a redundant pair of checkers. This part is inference.

Items 1, 4, and 6 directly affect automation code. How to respond is organized with priorities in the next section.

05Operations guide

Based on the behavior confirmed in our measurements, this section organizes the adoption procedure and the operational design. Priority 1 is the adoption procedure. The loop in the warning below can be avoided simply by following the procedure; the remaining items are complementary design layered on top.

Warning - Skipping the SG check drops you into a cascading replacement loop

If you attach a check to an existing ASG as included without allowing the check traffic in the SG inbound rules, new instances repeat boot → grace → 2 consecutive failures → termination. In our measurements, a total of 5 instances across 3 generations were replaced in 14 minutes. Instances keep dying even though the application is healthy.

The adoption order is: verify SG inbound first → create as excluded and observe on some instances for at least 2 cycles (about 2 minutes) → confirm the expected state with describe-application-status, then promote to included. If you are already in the loop, switch the check to excluded to stop the replacements, then fix the SG first.

5.1 Operational design checklist

After the adoption procedure comes operational design. All four items come from the gaps in section 04.

  1. Apply suppression in deployment hooks at least 3 minutes before the deployment. Propagation takes about 3.2 minutes after activation, and the live evaluation state stays visible in the meantime. We could not verify this time whether the ASG reacts to impaired during the un-propagated window, so we recommend a safe 3-minute wait.
  2. Design CloudWatch alarms on two tracks. The aggregate metric StatusCheckFailed_Application stops publishing while suppressed, so you must deliberately choose whether to treat missing data as notBreaching or leave it as missing. If you need observation independent of suppression, set alarms on the per-check metric (StatusCheckFailed_Application_{asc-id}). The describe API display was observed about 40-60 seconds behind the service timestamps, so metric-based automation is faster.
  3. Branch Reason parsers on the Code value. The "StatusCode": 0 field is present even for connection errors, so a parser written on the premise that the field is absent will break. Branching on Code values such as ConnectionTimeout and ConnectionRefused is safer.
  4. Add retry logic to IaC deletion automation. Even after the check is deleted, the managed ENI remains in-use for 20+ minutes, blocking deletion of the associated SG with DependencyViolation.

Conclusion: Summed up in one sentence, Application Status Checks fills the application layer that was the missing piece of status checks and connects it through to automatic ASG replacement; by our measurements, failure detection takes about 2 minutes and full recovery about 8.5 minutes. Verify the SG first, observe as excluded, then promote to included; apply suppression at least 3 minutes in advance; and split alarms into aggregate and per-check metrics - then every trap revealed in this verification can be avoided at the design stage.

Full interactive architecture map - the 60-second health check path through the managed ENI and the ASG replacement flow
Figure 2. Full view of the interactive architecture map. Click the image to open the interactive version ↗ with node exploration, path tracing, and dark/light themes.

--References

Primary sources

Official documentation