AMAZON EKS / LLM SERVING COLD START

EKS LLM 서빙 콜드스타트 428초에서 226초로 - 단계별 실측이 고른 레버 4개

31B급 모델을 vLLM으로 서빙할 때 콜드스타트를 노드, 이미지, 가중치, 컴파일 4구간으로 분해하고, 레버를 하나씩 쌓아 같은 환경에서 재실측한 결과와 권고를 정리합니다. 개선율과 구간별 수치는 전부 2026-08-30 g7e.2xlarge Spot 단일 환경 실측이고, 과거 L40S 수치는 배경으로만 인용했습니다. 조직명과 리소스 식별자는 제외했습니다.

01. 작성 기준일 - 2026-09-02

02. 적용 대상 - Amazon EKS에서 수십 GB급 LLM을 vLLM으로 서빙하는 플랫폼 팀

03. 시험 지표 및 환경 - pod 생성부터 /health 첫 통과까지의 기동 시간, g7e.2xlarge Spot, vLLM v0.26.0, Gemma-4-31B-IT NVFP4(가중치 31.2GiB)

04. 주 출처 - 2026-08-30 단계별 재실측 캠페인 원데이터(구간 분해 JSON, vLLM 로그 마커), vLLM 및 AWS 공식 문서

요약

01사실 관계 - 실측 환경과 결과 총괄

이 섹션은 무엇을 어디서 측정했는지와 최종 수치만 다룹니다. 해석과 권고는 04 섹션부터 나옵니다. 실측은 2026-08-30 하루 동안 같은 클러스터, 같은 인스턴스 계열에서 진행했습니다.

1.1 실측 환경

이 표에서 볼 것은 두 가지입니다. 노드가 Spot 단일 계열이라는 점과, 기동 시간의 정의가 pod 생성 시점부터 readinessProbe(컨테이너가 트래픽을 받을 준비가 됐는지 kubelet이 주기적으로 확인하는 검사) 첫 통과까지라는 점입니다. probe 주기가 10초라서 모든 총 기동 값은 10초 단위로 끊겨 기록되고, 최대 10초의 오차가 들어 있습니다.

표 1. 2026-08-30 재실측 환경
항목
리전 / 클러스터 ap-northeast-2, Amazon EKS 1.36, Karpenter v1.14
GPU 노드 g7e.2xlarge Spot (NVIDIA RTX PRO 6000 Blackwell 96GB, 1 GPU). 전 측정 동일 계열, 웜 측정은 동일 노드
서빙 vLLM v0.26.0 (vllm/vllm-openai:v0.26.0, 이미지 8.9GB)
모델 Gemma-4-31B-IT NVFP4, safetensors, 로드 실측 31.22GiB. 리전 내 S3 버킷에 사전 스테이징
모델 접근 자격 EKS Pod Identity로 S3 read 권한을 pod의 service account에 연결
측정 도구 pod conditions와 events로 k8s 구간을, vLLM 로그 마커로 가중치와 컴파일 구간을 분해하는 셸 하니스
총 기동 정의 pod 생성 → readinessProbe(/health) 첫 통과. probe 주기 10초 단위 오차 포함
참고 - 이 글에서 쓰는 네 가지 용어

콜드는 GPU 노드가 없는 상태에서 Karpenter 프로비저닝부터 시작하는 기동이고, 은 이미지와 캐시를 가진 같은 노드에서 pod만 재생성하는 기동입니다. 캐시류 레버는 캐시를 채우는 적재 회차와 캐시를 사용하는 히트 회차를 구분해 기록했습니다. 적재 회차는 이득이 없는 것이 정상이므로, 개선 수치는 항상 히트 회차 기준입니다.

1.2 결과 총괄

세 가지 운영 시나리오에서 얼마나 줄었는지가 이 표의 답입니다. 콜드 행의 226초에는 이미지 프리풀(C1)의 부분 효과 약 32초가 포함되어 있고, 웜과 유휴 복귀 행은 R1~R4만으로 나온 값입니다.

표 2. 시나리오별 기동 시간 변화 (g7e.2xlarge Spot, 2026-08-30)
시나리오 기준 구성 R1+R2+R4 (노드 로컬 캐시) R3 + C1 프리풀 개선
콜드 (노드 프로비저닝부터) 428초 (7분 8초) 306초 (R1+R2, 캐시 미스) 226초 (3분 46초, R3 히트) -47%
웜 재기동 (같은 노드) 314초 133초 (2분 13초) 133초 -58%
유휴 → 서빙 복귀 314초 (재기동) 0.97초 (R4 wake) 0.97초 약 320배

구간별로 귀속하면 가중치 로드는 127.6초에서 19.8초로 6.5배 빨라졌고(R1), 컴파일을 포함한 엔진 초기화는 캐시 히트 시 94.0초에서 29.6초로 약 68% 줄었습니다(R2, R3). 유휴 복귀는 R4가 재기동 자체를 대체한 결과입니다.

1.3 과거 실측과 직접 비교하지 않는 이유

같은 구성이라도 하드웨어 세대가 바뀌면 구간별 기준값이 달라집니다. 2026-08-05 L40S(g6e.2xlarge, 20Gbps) 실측에서는 기준 콜드가 537초, 가중치 로드가 149초, 스트리밍 로더 적용 후가 29~32초였습니다. 이번 g7e(50Gbps)에서는 같은 로더로 19.8초가 나왔습니다. 그래서 이 글의 개선율은 전부 동일 환경 재실측 안에서만 주장하고, 과거 수치는 배경으로만 언급합니다. L40S 기준 PoC 전체는 이전 글에 정리되어 있습니다.

02콜드스타트 해부 - 4구간과 레버 매핑

"기동이 7분 걸린다"는 말만으로는 무엇을 고칠지 정할 수 없습니다. 이 섹션은 기준 구성의 콜드 428초를 구간별로 쪼개고, 각 구간을 어느 레버가 공략하는지 연결합니다.

2.1 기준 구성의 구간 분해

이 표에서 볼 것은 가장 긴 구간이 어디인지입니다. 가중치 로드와 컴파일을 포함한 엔진 초기화가 합쳐서 221.5초로 전체의 절반을 넘습니다. 노드와 이미지 구간과 달리, 이 두 구간은 같은 노드에서 pod만 다시 만들어도 그대로 반복됩니다.

표 3. 기준 구성(Mountpoint FUSE + 기본 로더, 캐시 없음) 콜드 428초의 구간 분해
구간 실측 측정 근거 공략 레버
노드 프로비저닝 30초 Karpenter NodeClaim 생성 → node Ready C2 노드 선행 패턴 (조건부)
이미지 pull 65.1초 kubelet Pulled 이벤트, 8.9GB C1 프리풀 → 32~40초 (조건부)
가중치 로드 (S3 → GPU) 127.6초 vLLM 로그 Loading weights took R1 스트리밍 로더 직결 → 19.8초
엔진 초기화 (torch.compile 50.8초 포함) 93.9초 vLLM 로그 init engine took R2 + R3 캐시 → 29.6~30.4초
기타 (스케줄링, probe 간격 등) 약 111초 총 기동에서 위 네 구간을 뺀 잔여 -
합계 (pod 생성 → Ready) 428초 pod conditions

잔여 약 111초는 vLLM 프로세스가 가중치 로드에 들어가기 전 초기화(약 39초), 엔진 초기화 뒤 API 서버 기동(약 46초), pod 스케줄링 대기(약 15초), 컨테이너 시작 전 준비(약 4초), probe 주기 단위 오차(약 7초)의 합입니다. 이번 실험에서는 이 잔여를 별도 레버로 다루지 않았습니다.

flowchart TB N["노드 공급<br/>30초"] --> P["이미지 pull<br/>65초"] --> W["가중치 로드<br/>127.6초"] --> I["엔진 초기화 (compile 포함)<br/>94초"] --> R(["Ready"]) C2["C2 노드 선행 패턴<br/>조건부"] -.-> N C1["C1 이미지 프리풀<br/>65초 → 32~40초"] -.-> P R1["R1 스트리밍 로더 직결<br/>127.6초 → 19.8초"] -.-> W R23["R2 + R3 컴파일 캐시<br/>94초 → 29.6~30.4초"] -.-> I
그림 1. 콜드스타트 4구간과 레버 매핑. 실선은 기동 순서, 점선은 그 구간을 줄이는 레버입니다. 각 레버는 자기 구간에만 작용하므로 독립적으로 적용하고 독립적으로 측정할 수 있습니다.

2.2 웜 재기동 314초가 줄지 않는 이유

같은 노드에서 pod만 다시 만들면 노드 공급과 스케줄링 대기, 이미지 pull이 사라집니다. 기준 구성의 웜 재기동은 314초입니다. 콜드 428초와의 차이 114초는 노드 공급과 스케줄링 대기 45초, 이미지 pull 65초를 뺀 값과 거의 일치합니다. 가중치 127.8초와 컴파일 51.0초는 조금도 줄지 않았습니다.

원인은 두 가지입니다. Mountpoint for Amazon S3(S3 버킷을 파일 시스템처럼 마운트하는 FUSE 클라이언트)는 매 기동마다 S3에서 가중치를 다시 읽습니다. torch.compile 캐시는 기본 위치가 컨테이너 안의 /root/.cache라서 pod가 종료될 때 함께 사라집니다. 기본 구성에서는 재기동이 곧 재컴파일입니다.

03단계별 실험 사다리 - 레버 하나씩, 같은 환경에서

개선 폭을 레버 단위로 귀속하려면 한 번에 하나만 바꿔야 합니다. 이 섹션은 Stage 0에서 Stage 5까지 매니페스트를 어떻게 쌓았는지와, 구간을 어떻게 측정했는지를 설명합니다.

3.1 Stage 0에서 5까지

이 표에서 볼 것은 각 Stage가 직전 Stage와 정확히 레버 하나만 다르다는 점입니다. Stage 0에서 3은 선형 사다리이고, Stage 4는 노드 계층 레버의 별도 A/B, Stage 5는 Stage 2에서 갈라진 분기입니다. Deployment 이름을 모두 같게 두고 Recreate 전략을 쓰므로 Stage 전환은 kubectl apply 한 번입니다.

표 4. 단계별 실험 사다리와 2026-08-30 실측 결과
Stage 추가 레버 (직전 대비 1개) 공략 구간 실측 결과
0 Baseline Mountpoint FUSE 마운트 + 기본 로더, 캐시 없음 기준점 콜드 428초, 웜 314초
1 runai_streamer S3 직결 + env AWS_REGION 가중치 로드 127.8초 가중치 19.8초, 웜 204초
2 VLLM_CACHE_ROOT를 hostPath로 영속화 초기화 94초 (compile 51초 포함) 히트 회차 compile 6.6초, 초기화 29.6초, 웜 133초. 신규 노드 콜드는 306초(미스)
3 sleep mode (--enable-sleep-mode, gpu-memory-utilization 0.85) 재기동 자체 sleep 12.8초, wake 0.97초. 기동은 133초로 캐시 히트 유지
4 (별도 A/B) EC2NodeClass userData에서 이미지 사전 pull 이미지 pull 65초 pull 32.2초 / 39.8초 (n=2), "already present"는 불발
5 (Stage 2 분기) initContainer가 S3에서 compile 캐시를 hostPath로 프리로드 신규 노드의 캐시 미스 콜드에서 compile 6.98초 히트, 총 226초

3.2 구간을 나눈 방법

k8s 쪽 구간은 pod conditions(PodScheduled, Ready)와 events(Pulling, Pulled, Started)의 타임스탬프로 계산합니다. vLLM 쪽 구간은 컨테이너 로그의 마커 문장에서 읽습니다. 마커 문장은 원문 그대로 보존합니다. 하니스는 아래 마커를 추출해 결과 JSON 옆에 남깁니다.

측정 하니스 - vLLM 로그에서 구간 마커 추출
kubectl -n serving logs "$POD" > results-stages/"$LABEL".log
grep -nE 'Loading weights took|Model loading took|init engine|Compiling a graph|graph capture|Application startup complete|Starting vLLM' \
  results-stages/"$LABEL".log > results-stages/"$LABEL".markers

# 기준 콜드(stage0-cold)에서 잡힌 마커 가운데 구간 계산에 쓰는 세 줄 발췌
# [default_loader.py] Loading weights took 127.63 seconds
# [backends.py] Compiling a graph for compile range (1, 8192) takes 32.61 s
# [core.py] init engine (profile, create kv cache, warmup model) took 93.90 s (compilation: 50.84 s)

마커 원문은 "compile 50.8초"가 어느 줄에서 나온 값인지 나중에 되짚는 근거로 남깁니다. 엔진 초기화 마커의 괄호 안 compilation 값이 이 글의 compile 열이고, 바깥 값이 초기화 전체 열입니다.

3.3 측정 규율 세 가지

  • 캐시류 레버는 적재 회차와 히트 회차를 라벨로 구분합니다(stage2-warm-1st, stage2-warm-2nd). 히트 판정은 compile 구간 급감과 캐시 디렉터리 크기 확인으로 이중 검증합니다.
  • 컨테이너 재시작이 감지된 런은 무효 처리합니다. 재시작 뒤의 startedAt은 재시작 시각이라 구간이 왜곡됩니다. 하니스가 restartCount를 결과에 기록합니다.
  • 인스턴스 타입과 capacity type(Spot/On-Demand)을 결과마다 병기합니다. NIC 대역폭이 가중치 구간을 좌우하므로, 이 값이 없는 수치는 비교에 쓰지 않습니다.

이번 캠페인의 반복 횟수는 시나리오당 1~2회입니다. 재현 편차를 ±10% 안에서 주장하려면 n≥3이 필요하므로, 아래 개선 폭은 방향과 크기의 근거로 읽되, 소수점 단위의 정밀도로는 읽지 않아야 합니다.

04권고 R1~R4 - 실측으로 검증된 레버

이 섹션의 네 레버는 모두 같은 환경에서 효과가 측정된 것입니다. 각 레버마다 실측값, 적용 방법, EKS 구조에 미치는 함의, 성립 조건을 같은 순서로 정리합니다. 적용 순서는 R1부터 R4까지 그대로입니다.

참고 - 전제 P0, 가중치는 리전 내 S3에 1회 스테이징

아래 권고는 모델 가중치가 리전 내 S3 버킷에 미리 올라가 있음을 전제합니다. 온보딩 시 한 번 Hugging Face에서 내려받아 s5cmd sync로 올리는 방식입니다. 서빙 pod가 Hugging Face에서 직접 로드하는 구성은 권하지 않습니다. 콜드마다 수십 GB를 인터넷에서 다시 내려받습니다. private subnet에서는 이 트래픽이 NAT를 경유합니다. 다운로드 캐시도 컨테이너 안에 있으므로 pod를 재생성하면 사라집니다. 이 글의 모든 가중치 수치는 S3에서 GPU까지의 구간입니다.

4.1 R1 - 가중치는 FUSE 마운트 대신 스트리밍 로더로 S3 직결

가중치 로드 127.6초는 대역폭 문제가 아니었습니다. 31.22GiB(약 33.5GB)를 127.6초에 읽으면 실효 약 2.1Gbps로, g7e.2xlarge의 NIC 50Gbps에 한참 못 미칩니다. FUSE 경로가 단일 스트림으로 읽는 구조 자체가 병목이었습니다.

vLLM에 포함된 오픈소스 로더 RunAI Model Streamer(--load-format=runai_streamer)는 s3:// 경로를 직접 받아 병렬 range read를 수행합니다. 같은 버킷, 같은 가중치에서 127.6초가 19.8초로 6.5배 빨라졌고 실효 대역폭은 약 13.6Gbps였습니다. 이 단계에서 초기화 94.4초(compile 51.1초 포함)는 바뀌지 않아 단일 변수 격리가 성립합니다.

Deployment - vLLM 컨테이너 args와 env (R1)
containers:
  - name: vllm
    image: vllm/vllm-openai:v0.26.0
    args:
      - --model=s3://<model-bucket>/Gemma-4-31B-IT-NVFP4/   # FUSE 경로(/data/...) 대신 s3:// 직접 지정
      - --load-format=runai_streamer
      - '--model-loader-extra-config={"concurrency":64,"memory_limit":25769803776}'  # 2xlarge(64GiB RAM) 기준 버퍼 24GiB
      - --served-model-name=gemma4-31b
      - --max-model-len=8192
    env:
      - name: AWS_REGION            # s3:// 직결의 필수 종속 env (리전 명시)
        value: ap-northeast-2

concurrencymemory_limit은 노드 RAM을 CPU 스테이징 버퍼로 씁니다. 인스턴스 타입이 바뀌면 이 두 값을 함께 조정해야 하므로, 매니페스트에 인스턴스 타입별 권장값을 주석으로 남기는 것이 좋습니다.

EKS 구조에 미치는 함의는 네 가지입니다.

  • 자격은 EKS Pod Identity로 부여합니다. S3 read 권한을 pod의 service account에 직접 연결하고, 노드 IAM role에는 권한을 얹지 않습니다. 그래서 pod 단위 최소 권한이 유지됩니다.
  • NIC 대역폭이 새 한계가 됩니다. L40S(20Gbps 버스트) 노드에서 29~32초, g7e(50Gbps)에서 19.8초였습니다. 환경이 달라 NIC 외 요인도 섞여 있지만, GPU 사양만 보고 노드를 고르면 로드 시간을 놓칩니다.
  • S3 gateway endpoint 경로를 확보합니다. 재기동마다 가중치 크기만큼 NAT 게이트웨이 처리 요금이 발생하는 것을 막습니다.
  • Mountpoint S3 CSI는 제거하지 않고 보조 파일(draft 모델, 토크나이저) 접근용으로 역할을 낮춥니다.

4.2 R2 - torch.compile 캐시를 컨테이너 밖 노드에 영속화

vLLM은 기동 시 torch.compile로 그래프를 컴파일하고 CUDA graph를 캡처합니다. 이 산출물은 VLLM_CACHE_ROOT 아래에 캐시되는데, 기본값이 컨테이너 안이라 pod 재생성마다 사라집니다. Stage 1까지 적용한 웜 재기동 204초 중 초기화 94초(그중 컴파일 51초)가 이 때문에 매번 반복됐습니다.

VLLM_CACHE_ROOT를 hostPath(노드 디스크의 디렉터리를 pod에 직접 마운트하는 볼륨)로 옮기면 두 번째 기동부터 캐시가 히트합니다. 히트 회차에서 compile은 50.9초에서 6.6초로, 초기화 전체는 94.0초에서 29.6초로 약 68% 줄었습니다. 웜 재기동 전체는 204초에서 133초가 됐습니다. 적재 회차(첫 기동)는 204초로 이득이 없는 것이 정상입니다.

Deployment - 캐시 env와 hostPath 볼륨 (R2)
containers:
  - name: vllm
    env:
      - name: VLLM_CACHE_ROOT       # 기본값 /root/.cache 대신 마운트된 경로로
        value: /vllm-cache
    volumeMounts:
      - name: vllm-cache
        mountPath: /vllm-cache
volumes:
  - name: vllm-cache
    hostPath:                        # 캐시 수명 = 노드 수명. 노드가 회수되면 함께 사라짐
      path: /var/cache/vllm
      type: DirectoryOrCreate

구성 비용이 0에 가까운 레버지만 한계가 분명합니다. 캐시가 노드 로컬에 있으므로 Karpenter consolidation이나 Spot 중단으로 노드가 바뀌면 사라집니다. 신규 노드 콜드는 R1과 R2를 적용해도 306초로, compile 51.1초가 그대로 돌아옵니다. 이 한계를 R3가 풉니다.

기준 구성 웜 재기동 314초
+ R1 스트리밍 로더 204초
+ R2 캐시 히트 133초
그림 2. 같은 노드 웜 재기동에서 레버 두 개의 귀속. R1이 110초, R2가 71초를 줄였고 두 값은 서로 다른 구간에서 나왔습니다.

캐시 키는 계약입니다. vLLM의 캐시 키에는 모델 경로, 컴파일 관련 구성, vLLM 버전이 들어갑니다. 과거 실측(2026-08-05, L40S)에서는 /data 경로로 적재한 캐시가 모델 경로를 s3://로 바꾸는 순간 캐시 미스가 났습니다. 이번 사다리의 Stage 0과 1은 캐시를 영속화하지 않은 구성이라 이 전환을 직접 관측하지는 않았습니다.

반대로 이번 재실측에서 --enable-sleep-mode 추가와 gpu-memory-utilization 변경은 히트를 유지했습니다. 키에는 컴파일에 영향을 주는 구성만 들어가고, 그 밖의 플래그는 포함되지 않는다는 뜻입니다. 배포 구성을 고정하고, 경로 변경은 콜드 컴파일을 동반한다는 사실을 릴리스 절차에 적어 두어야 합니다.

4.3 R3 - 컴파일 캐시를 S3로 배포해 신규 노드에서도 히트

R2의 캐시는 노드가 바뀌면 사라집니다. 그런데 이 캐시는 크지 않습니다. 실측 크기는 218MB, 1,204개 객체였고 리전 내 S3에서 내려받는 데 수 초가 걸립니다. 컴파일 51초와 비교하면 캐시를 옮기는 비용이 훨씬 저렴합니다.

Stage 5는 initContainer(본 컨테이너보다 먼저 실행되는 준비용 컨테이너)가 S3에서 캐시를 hostPath로 내려받은 뒤 vLLM을 기동합니다. 신규 노드 콜드에서 compile 6.98초 히트가 나왔고 초기화 전체는 30.4초, 총 콜드는 226초였습니다. 같은 프리풀 NodeClass 조건의 다른 신규 노드에서 캐시 미스였던 회차가 297초였으므로 총 기동 차이는 71초입니다.

이 71초가 전부 R3 효과는 아닙니다. R3에 귀속되는 초기화 구간은 94.3초에서 30.4초로 약 64초 줄었고, 나머지 약 8초는 이미지 pull이 39.8초에서 32.2초로 달라진 회차 간 편차입니다. 표준 NodeClass의 콜드 306초와 비교한 80초에는 이미지 프리풀(C1)의 부분 효과가 더해져 있습니다.

Deployment - 캐시 프리로드 initContainer (R3)
initContainers:
  - name: cache-preload
    image: amazon/aws-cli:latest
    command: ["/bin/sh", "-c"]
    args:
      - |
        PFX="s3://<model-bucket>/vllm-cache/v0.26.0-nvfp4/"   # vLLM 버전과 구성 식별자를 prefix에
        N=$(aws s3 ls "$PFX" --recursive 2>/dev/null | wc -l)
        echo "[cache-preload] source objects: $N"           # 0이면 무증상 미스. 반드시 로그로 남김
        aws s3 sync "$PFX" /vllm-cache/ --only-show-errors || true   # 실패해도 기동 진행(콜드 컴파일 폴백)
        du -sh /vllm-cache || true
    env:
      - name: AWS_REGION
        value: ap-northeast-2
    volumeMounts:
      - name: vllm-cache
        mountPath: /vllm-cache

캐시를 S3에 올리는 쪽은 별도 절차입니다. 해당 구성의 첫 기동이 끝난 뒤 한 번만 실행하고, initContainer가 읽는 prefix와 문자열이 정확히 같아야 합니다.

캐시 게시 - 첫 기동(적재 회차) 이후 1회 실행
kubectl -n serving exec deploy/gemma4-31b -- \
  aws s3 sync /vllm-cache s3://<model-bucket>/vllm-cache/v0.26.0-nvfp4/

# vllm-openai 이미지에 aws cli가 없으면 hostPath를 마운트한 별도 pod에서 실행
# 실측: 218M /vllm-cache, uploaded objects 1204

이 레버가 있어야 Spot 우선 NodePool 전략과 캐시 전략이 양립합니다. 같은 아키텍처 노드로 교체되는 경우에 한해 Spot 중단 뒤에도 컴파일 비용이 돌아오지 않을 것으로 추정합니다. 이 추정은 신규 노드 히트 실측(콜드 226초)에서 외삽한 값이고, Spot 중단 폴백 경로 자체는 실측하지 않았습니다.

flowchart TB subgraph A["GPU 노드 A - 첫 기동 (캐시 미스)"] VA["vLLM 기동<br/>compile 51초"] -->|"캐시 기록"| HA["R2 hostPath<br/>/var/cache/vllm"] end HA -->|"게시 1회 (prefix 한정 PutObject)"| S[("S3 vllm-cache/<br/>218MB, 1,204 객체")] S -->|"R3 프리로드 (수 초)"| IC["initContainer<br/>aws s3 sync"] subgraph B["GPU 노드 B - 신규 또는 Spot 교체"] IC --> HB["hostPath<br/>프리로드됨"] --> VB["vLLM 기동<br/>compile 6.98초 히트"] end
그림 3. 캐시 수명을 컨테이너에서 노드로, 노드에서 S3로 끌어올리는 구조. R2는 pod 재생성을 넘기고(웜 133초), R3는 노드 교체를 넘깁니다(콜드 226초). 프리로드가 실패하면 콜드 컴파일로 돌아가므로 기동은 막히지 않습니다.

성립 조건은 네 가지입니다.

  • S3 prefix에 vLLM 버전과 구성 식별자를 넣고, 구성이 바뀌면 다시 게시합니다.
  • 게시용 쓰기 권한은 해당 prefix로 한정한 s3:PutObject로 분리합니다. 서빙 자격은 read 전용을 유지합니다.
  • initContainer는 실패를 허용하되 소스 객체 수를 로그로 남깁니다. 빈 prefix에 대한 s3 sync는 아무것도 전송하지 않고 exit 0으로 끝나서, 로그가 없으면 미스를 알아챌 방법이 없습니다.
  • GPU 아키텍처 간 이식성은 미검증입니다. 이번 실측은 g7e에서 g7e(Blackwell)로의 이식만 확인했습니다. Spot 폴백으로 g6e(Ada)가 섞이는 NodePool이면 검증 전까지 아키텍처별 prefix를 나눠야 합니다.

4.4 R4 - 유휴와 활성 사이의 전환은 sleep/wake로

요청이 없는 시간대에 GPU 메모리를 비우고 싶을 때, 지금까지의 선택은 replicas를 0으로 내리는 것이었습니다. 복귀는 콜드 경로라 226초가 듭니다. vLLM sleep mode는 프로세스와 컴파일 상태를 유지한 채 GPU 메모리만 반납합니다. level 1은 가중치를 CPU RAM에 보존하므로 깨울 때는 S3 재로드나 재컴파일 없이 가중치를 GPU로 되돌리기만 합니다.

실측은 POST /sleep?level=1이 12.8초, POST /wake_up0.97초였습니다. wake 직후 추론 지연은 0.30초로 sleep 전 0.28초와 거의 같아 정합을 확인했습니다. 웜 재기동 133초와 비교하면 약 137배 빠릅니다.

sleep/wake 측정 - port-forward 후 실행
kubectl -n serving port-forward svc/gemma4-31b 8000:8000 &
time curl -sX POST 'localhost:8000/sleep?level=1'   # GPU 메모리 반납, 가중치는 CPU RAM 보존 (실측 12.8초)
time curl -sX POST 'localhost:8000/wake_up'         # 복귀 (실측 0.97초)
curl -s localhost:8000/v1/models                    # 추론 가능 확인
주의 - sleep mode와 gpu-memory-utilization 0.90을 함께 켜면 기동이 실패합니다

sleep mode가 강제하는 cumem allocator는 non-torch 메모리를 음수로 잘못 계산합니다. g7e 실측 로그에는 -4.04 GiB for non-torch memory가 찍혔고, 그 결과 KV 캐시 산정이 예산을 약 1GiB 초과해 (56.77 GiB 사용 vs 허용 55.68GiB) 엔진이 크래시루프에 빠졌습니다. sleep 병용 시 gpu-memory-utilization0.85로 두거나, vLLM이 로그로 제안하는 고정 --kv-cache-memory 값을 쓰는 것이 필수입니다.

/sleep/wake_upVLLM_SERVER_DEV_MODE=1로 열리는 개발용 엔드포인트입니다. Service와 NetworkPolicy로 노출 범위를 통제해야 합니다.

flowchart LR SL["Sleep (level 1)<br/>GPU 반납, 가중치는 CPU RAM 보존"] SV["Serving<br/>GPU 점유, 추론 중"] Z["Scale-to-zero<br/>노드 반납, 노드 비용 0"] SV -->|"sleep 12.8초"| SL SL -->|"wake 0.97초"| SV SV -->|"replicas 0"| Z Z -->|"콜드 226초"| SV
그림 4. 유휴 전략은 두 층으로 나눕니다. 짧은 유휴는 Sleep(복귀 0.97초, 노드 과금 지속), 야간 같은 장시간 유휴는 Scale-to-zero(복귀 226초, 비용 0)로 나눕니다.

sleep 상태에서도 GPU 인스턴스 과금은 계속됩니다. 유휴 구간의 기대 길이를 T, 노드 시간당 단가를 C라고 하면 sleep은 T×C의 유휴 비용을 내는 대신 0.97초에 복귀하고, scale-to-zero는 유휴 비용 없이 226초에 복귀합니다. 복귀 지연의 SLO 페널티가 이 차액을 넘는지가 판단 기준입니다. 수요 패턴 데이터를 먼저 확보한 뒤 결정합니다.

05조건부 권고와 비권고

R1~R4 밖에도 검토한 레버가 있습니다. 둘은 특정 운영 패턴에서만 성립해 조건부로 남겼고, 셋은 검토 후 제외했습니다. 제외 근거를 남겨 두면 같은 질문이 다시 나올 때 판단을 반복하지 않아도 됩니다.

5.1 C1 - 이미지 사전 pull은 부분 효과만 확인

EC2NodeClass의 userData에서 노드 부팅 직후 vLLM 이미지를 백그라운드로 pull하면 kubelet의 pull이 짧아질 것이라는 가설을 A/B로 확인했습니다. 결과는 부분 효과였습니다. 표준 NodeClass의 64~65초가 프리풀 NodeClass에서는 32.2초와 39.8초(n=2)로 줄었습니다.

pull 0초를 뜻하는 "already present" 이벤트는 두 번 다 나오지 않았습니다. Karpenter는 노드가 Ready가 되는 즉시 pod를 스케줄하므로, userData의 프리풀과 kubelet의 pull이 같은 이미지를 놓고 경합합니다. containerd가 레이어를 공유해 절반 정도만 절감되는 구조입니다. pull 0초는 노드가 워크로드보다 먼저 존재하는 패턴(C2)에서만 가능합니다.

EC2NodeClass userData - best-effort 프리풀 (C1)
#!/bin/bash
# containerd 소켓이 열릴 때까지 기다린 뒤 백그라운드로 pull. 실패해도 노드 조인은 진행
(
  for i in $(seq 1 60); do
    [ -S /run/containerd/containerd.sock ] && break
    sleep 5
  done
  ctr -n k8s.io images pull docker.io/vllm/vllm-openai:v0.26.0 >>/var/log/vllm-prepull.log 2>&1
) &

약 30초를 더 줄여야 하는 환경이면 켜도 손해는 없습니다. 다만 userData의 이미지 태그와 Deployment의 태그가 어긋나면 프리풀이 무효가 되고 pull 65초로 조용히 돌아갑니다. 태그 동기화를 배포 절차에 넣어야 합니다. 리전 내 미러인 ECR pull through cache는 남은 32초를 더 줄일 후보지만 이번에는 측정하지 않았습니다.

5.2 C2 - 캐시 노드 보존과 warm pool은 수요 데이터로 결정

NodePool의 consolidateAfter를 연장해 유휴 GPU 노드를 보존하거나, 낮은 priorityClass의 pause pod로 노드를 상시 확보하는 warm pool은 콜드를 웜으로 바꾸는 유일한 구조 레버입니다. 대가는 보존 시간에 노드 단가를 곱한 유휴 비용입니다.

재기동 간격 분포 없이 결정하지 않는 것이 이 글의 권고입니다. 히트율에 지연 절감(226초 - 133초 = 93초)을 곱해 SLO 페널티로 환산한 금액이 보존 비용을 넘는 지점을 데이터로 찾아야 합니다. 한 GPU 안에서 같은 목적을 더 저렴하게 달성하는 R4가 있으므로, warm pool은 다중 레플리카 스케일아웃에 대비할 때 성립합니다.

5.3 비권고 X1~X3

이 표에서 볼 것은 세 항목이 모두 미실측 단계에서 제외됐다는 점입니다. 측정 없이 판단한 이유는 각각 대체 레버가 같은 목표를 더 가볍게 달성했기 때문입니다. 조건이 바뀌면 재검토 대상입니다.

표 5. 검토 후 제외한 레버와 근거
ID 항목 제외 근거 재검토 조건
X1 SOCI lazy loading LLM 서빙은 기동 시 대부분의 레이어를 실제로 읽어 lazy 이득이 제한적입니다. pull 비용이 가중치 로드 구간으로 이연되어 겉으로만 빨라질 위험이 있고, 비표준 snapshotter 운영 부담이 절감폭보다 큽니다. 이미지 구간이 주 병목으로 남을 때
X2 가중치 EBS pre-bake R1이 이미 19.8초라 한계효용이 낮습니다. 모델 갱신마다 스냅샷을 다시 구워야 해서 S3 단일 진실 원천의 이점을 잃습니다. 가중치 구간에 초 단위 SLO가 붙을 때
X3 컴파일 캐시 EBS pre-bake R3(S3 프리로드, 218MB)가 같은 목표를 훨씬 가볍게 달성합니다. 스냅샷 신선도 관리와 lazy restore 지연 검토가 추가됩니다. initContainer 단계조차 없는 초 단위 기동이 필요할 때

06운영 수칙 - 실험이 가르친 함정

수치보다 오래 남는 것은 실험 도중 밟은 함정입니다. 이 섹션은 재실측이 정정한 인식과, 그로부터 나온 운영 수칙 다섯 가지를 정리합니다.

6.1 재실측이 정정한 인식

이 표에서 볼 것은 "실측 완료"로 분류돼 있던 항목과 추정이나 가설로 남아 있던 항목이 같은 환경에서 실측을 거치며 어떻게 바뀌었는지입니다. F-1은 실제 기동 실패로 드러났고, F-2는 캐시 키 범위를 잘못 알고 있던 것을 바로잡은 항목입니다. F-3~F-6은 수치의 정밀화이고, F-7과 F-8은 가설이 실측으로 확정된 항목입니다.

표 6. 2026-08-30 재실측이 정정한 여덟 가지
# 항목 이전 인식 재실측 결과
F-1 sleep mode 안전성 "실측 완료" gpu-memory-utilization 0.90과 병용 시 기동 실패. 0.85 필수. 운영 매니페스트 수정
F-2 compile 캐시 키 모델 경로와 플래그 변경 시 미스 sleep 플래그와 gmu 변경에도 히트 유지. 키에는 컴파일 관련 구성만 포함
F-3 개선 구성의 콜드 약 4.5분 vs 약 7분 추정 충돌 306초(5분 6초) 실측으로 종결
F-4 sleep / wake 시간 26.8초 / 3.6초 (L40S) g7e에서 12.8초 / 0.97초
F-5 기준 웜 재기동 미실측 (약 400초 추정) 314초 실측
F-6 스트리밍 로더 실효 대역폭 29~32초 (L40S, 20Gbps) g7e(50Gbps)에서 19.8초, 약 13.6Gbps
F-7 이미지 프리풀 순효과 0~82초 가설 64~65초 → 32~40초 (n=2). pull 0초는 노드 선행 패턴 필요
F-8 캐시 S3 프리로드 작업 가설 신규 노드 콜드 compile 6.98초 히트, 총 226초. 동일 아키텍처 이식 성립

6.2 운영 수칙 다섯 가지

  1. "실측 완료"는 구성 조합 단위의 속성입니다. sleep mode(검증됨)와 gpu-memory-utilization 0.90(검증됨)의 교집합은 미검증이었고 실제로 깨졌습니다. 레버를 하나씩 쌓는 단계별 A/B는 이런 조합을 반드시 한 번은 실측하게 만드는 안전장치입니다.
  2. 캐시 키는 계약입니다. 모델 경로, 컴파일 구성, vLLM 버전 중 하나라도 바뀌면 콜드 컴파일입니다. 릴리스 노트에 이번 배포가 캐시 미스를 동반하는지 적습니다.
  3. 무증상 실패를 측정합니다. 빈 prefix에 대한 s3 sync(exit 0), 프리풀 태그 불일치, Terminating 중인 pod의 Ready=True는 전부 오류를 내지 않은 채 성능만 예전 값으로 되돌립니다. 측정 하니스에 구간 분해, 적재/히트 회차 구분, 재시작 감지를 넣어야 이런 실패가 보입니다.
  4. 하드웨어 세대가 기준값을 바꿉니다. 같은 구성에서도 NIC와 GPU 세대에 따라 구간별 시간이 달라졌습니다. 개선율은 동일 환경 재실측으로만 주장합니다.
  5. 아키텍처가 섞인 NodePool(Spot 폴백)에서는 컴파일 캐시 이식성이 검증되기 전까지 폴백 노드의 콜드 컴파일을 예산에 넣습니다.

07적용 의사결정표

어느 레버를 어디까지 적용할지는 운영 패턴이 정합니다. 이 표에서 볼 것은 자기 운영 상황에 해당하는 행 하나입니다. 자주 만나는 네 가지 상황을 권고 조합과 실측 근거에 대응시켰습니다.

표 7. 운영 상황별 권고 조합과 기대 효과
우리 환경은 권고 조합 기대 효과 (실측 근거)
재기동이 잦다 (배포, 튜닝 반복) R1 + R2 웜 재기동 314초 → 133초
Spot 위주라 노드가 자주 바뀐다 R1 + R2 + R3 (+ C1) 노드 교체 콜드 428초 → 226초 (C1 포함)
수요가 간헐적이다 (유휴 구간 존재) + R4 복귀 0.97초. 장시간 유휴는 scale-to-zero와 계층화
콜드 SLO가 3분대도 부족하다 C2 검토 노드 선행 시 콜드가 웜(133초)으로 수렴. C1의 pull 절감은 226초에 이미 포함

적용 순서도 실측이 정합니다. 가장 긴 구간을 가장 낮은 난이도로 줄이는 R1이 먼저이고, 구성 비용이 없는 R2, Spot 전략과 양립시키는 R3, 수요 패턴을 확인한 뒤의 R4 순서입니다.

원칙: 어느 구간이 긴지 먼저 재고, 그 구간의 레버만 하나씩 넣어 같은 환경에서 다시 잽니다. 측정 없이 넣은 레버는 효과를 주장할 수 없습니다.

08결론과 잔여 미실측

한 문장으로 요약하면, 가중치 경로(R1)와 컴파일 캐시 수명(R2, R3)을 고치고 이미지 프리풀(C1)을 더하면 EKS 위 31B급 LLM 서빙의 콜드스타트는 428초에서 226초로 줄고, 유휴 복귀는 sleep/wake(R4)로 0.97초가 됩니다. 네 레버는 모두 vLLM과 EKS의 기존 기능 조합이라 별도 컴포넌트를 들이지 않습니다.

8.1 계층별 최종 권고

  • 가중치 전송 계층 - Mountpoint FUSE 마운트는 보조 파일용으로 낮추고, 기동 경로는 runai_streamer S3 직결로 바꿉니다. Pod Identity와 S3 gateway endpoint를 함께 갖춥니다.
  • 컴파일 캐시 계층 - VLLM_CACHE_ROOT를 hostPath로 옮기고, 캐시를 S3에 게시해 initContainer로 프리로드합니다. prefix에 버전과 구성 식별자를 넣습니다.
  • 프로세스 수명 계층 - 짧은 유휴는 sleep mode, 장시간 유휴는 scale-to-zero로 나눕니다. sleep 병용 시 gpu-memory-utilization은 0.85입니다.
  • 노드와 이미지 계층 - 프리풀은 켜되 단독 효과를 기대하지 않고, 노드 보존과 warm pool은 재기동 간격 데이터가 쌓인 뒤 결정합니다.

8.2 아직 재지 않은 것

세 항목이 미실측으로 남았습니다. 첫째는 g7e(Blackwell)에서 만든 compile 캐시가 g6e(Ada) 폴백 노드에서 유효한지입니다. Spot 폴백 경로에 R3를 적용하기 위한 마지막 관문이고, 실패하면 아키텍처별 S3 prefix로 나눕니다. 둘째는 캐시 노드 보존과 warm pool의 보존 시간별 웜 히트율로, 운영 데이터가 쌓여야 판정할 수 있습니다. 셋째는 ECR pull through cache로 남은 pull 32초를 더 줄일 수 있는지입니다.

8.3 부록 - 근거 실측 전표

이 글의 기동 구간 수치와 sleep/wake 수치가 나온 원표입니다. 이 표에서 볼 것은 본문의 각 수치가 어느 측정 회차에서 나왔는지입니다. 단위는 초이고, "초기화 전체"는 compile 시간을 포함한 vLLM init engine took 마커 값입니다. 대역폭은 이 표의 가중치 시간에서 십진 Gbps(31.22GiB는 약 33.5GB)로 계산했고, 캐시 크기와 크래시루프 로그, 과거 L40S 값은 본문 해당 절의 실측 기록을 따릅니다.

표 8. 2026-08-30 g7e.2xlarge Spot 전 측정 (단위: 초)
측정 시나리오 총 기동 이미지 pull 가중치 compile 초기화 전체 비고
stage0-cold 콜드 428 65.1 127.6 50.8 93.9 Mountpoint, 캐시 없음. 노드 30초
stage0-warm 314 캐시 127.8 51.0 94.0 가중치, 컴파일 절감 0
stage1-warm 204 캐시 19.8 51.1 94.4 +R1
stage2-warm-1st 웜 (적재 회차) 204 캐시 19.3 50.9 94.0 +R2, 캐시를 채우는 회차
stage2-warm-2nd 웜 (히트 회차) 133 캐시 19.1 6.6 29.6 +R2 히트
stage2-cold 콜드 306 63.9 19.9 51.1 94.3 신규 노드 = 캐시 미스. 노드 29초
stage3-warm 웜 (히트) 133 캐시 19.8 6.4 30.2 +sleep mode, gmu 0.85
stage5-cold-miss 콜드 (프리풀 노드) 297 39.8 20.9 51.2 94.3 R3 격리 대조군. 노드 30초
stage5-cold-hit 콜드 (프리풀 노드, 캐시 히트) 226 32.2 20.1 6.98 30.4 +R3 히트, C1 부분 효과. 노드 30초
stage3-sleepwake sleep → wake - - - - - sleep 12.8초, wake 0.97초, 추론 0.28초 → 0.30초

GPU 사용은 Spot g7e 합계 약 1.5시간이었습니다. 오후 캠페인(Stage 0~3, 크래시루프 진단 약 15분 포함)이 약 1시간, 저녁 캠페인(Stage 4, 5)이 약 25분입니다.
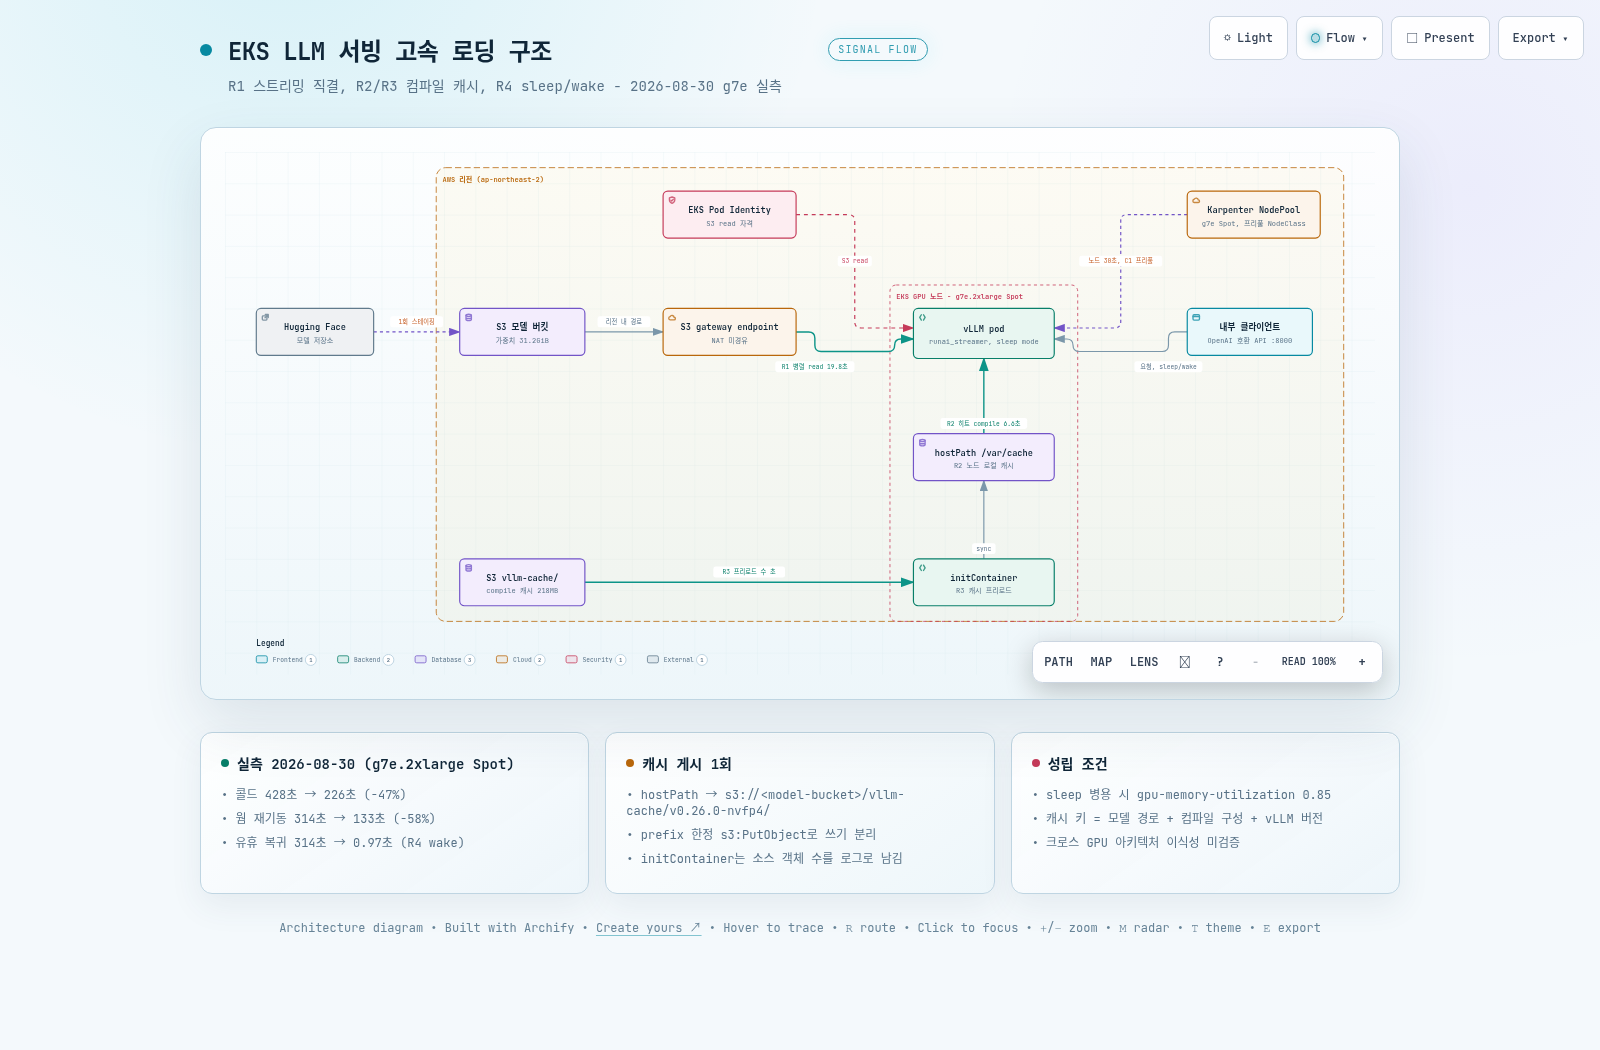
인터랙티브 아키텍처 맵 전체 이미지 - S3 모델 버킷에서 gateway endpoint를 거쳐 GPU 노드의 vLLM pod로 가중치가 직결되고, 컴파일 캐시가 hostPath와 S3 사이를 오가며, Pod Identity가 S3 read 자격을 공급하는 구조
그림 5. 인터랙티브 아키텍처 맵 전체 보기. 이미지를 클릭하면 노드 탐색, 경로 추적, 다크/라이트 테마를 지원하는 인터랙티브 버전 ↗이 열립니다.

--참고 자료

핵심 출처

  • Gemma-4-31B vLLM 서빙 PoC 벤치마크 - 이 블로그 (2026-08-09). L40S 기준선과 g7e 본판정, 스타트업 단축 A/B의 1차 실측 https://whchoi98.github.io/docs/techblog/aiml/gemma4-vllm-serving-benchmark/
  • Loading models with Run:ai Model Streamer - vLLM 문서. --load-format runai_streamer, S3 경로, concurrency와 memory_limit 옵션 https://docs.vllm.ai/en/latest/models/extensions/runai_model_streamer.html
  • vLLM environment variables - vLLM 문서. VLLM_CACHE_ROOT, VLLM_SERVER_DEV_MODE https://docs.vllm.ai/en/latest/configuration/env_vars.html

AWS 공식 문서

Karpenter와 외부 자료

  • Karpenter NodeClasses - EC2NodeClass userData(C1 프리풀), amiSelectorTerms, blockDeviceMappings https://karpenter.sh/docs/concepts/nodeclasses/
  • Karpenter Disruption - consolidation과 consolidateAfter(C2 노드 보존) https://karpenter.sh/docs/concepts/disruption/
  • soci-snapshotter - awslabs GitHub. X1 검토 시 참조 https://github.com/awslabs/soci-snapshotter

AMAZON EKS / LLM SERVING COLD START

EKS LLM Serving Cold Start from 428s to 226s - Four Levers Chosen by Stage-by-Stage Measurement

When serving a 31B-class model with vLLM, this article breaks cold start into four stages (node, image, weights, and compile), stacks the levers one at a time, and reports the re-measured results and recommendations from the same environment. Improvement rates and per-stage numbers are all measurements from a single g7e.2xlarge Spot environment on 2026-08-30; past L40S numbers are cited only as background. Organization names and resource identifiers are omitted.

01. Written as of - 2026-09-02

02. Audience - platform teams serving tens-of-GB LLMs with vLLM on Amazon EKS

03. Metrics and environment - startup time from pod creation to the first /health pass, g7e.2xlarge Spot, vLLM v0.26.0, Gemma-4-31B-IT NVFP4 (weights 31.2GiB)

04. Primary sources - raw data from the 2026-08-30 stage-by-stage re-measurement campaign (stage-breakdown JSON, vLLM log markers), vLLM and AWS official documentation

TL;DR

01Facts - measurement environment and overall results

This section covers only what was measured, where, and the final numbers. Interpretation and recommendations start in section 04. All measurements were taken on a single day, 2026-08-30, on the same cluster and the same instance family.

1.1 Measurement environment

Two things to note in this table. The nodes are a single Spot family, and startup time is defined as pod creation to the first readinessProbe (the check the kubelet runs periodically to confirm the container is ready to receive traffic) pass. Because the probe period is 10 seconds, every total startup value is recorded in 10-second steps and carries up to 10 seconds of error.

Table 1. Re-measurement environment, 2026-08-30
Item Value
Region / cluster ap-northeast-2, Amazon EKS 1.36, Karpenter v1.14
GPU node g7e.2xlarge Spot (NVIDIA RTX PRO 6000 Blackwell 96GB, 1 GPU). Same family for all measurements, same node for warm measurements
Serving vLLM v0.26.0 (vllm/vllm-openai:v0.26.0, 8.9GB image)
Model Gemma-4-31B-IT NVFP4, safetensors, 31.22GiB measured at load. Pre-staged in an in-region S3 bucket
Model access credentials EKS Pod Identity attaches S3 read permission to the pod's service account
Measurement tooling A shell harness that breaks down the k8s stages from pod conditions and events, and the weight and compile stages from vLLM log markers
Total startup definition Pod creation → first readinessProbe (/health) pass. Includes 10-second-step error from the probe period
Note - four terms used in this article

Cold is a startup that begins with Karpenter provisioning when no GPU node exists, and warm is a startup that recreates only the pod on the same node, which already holds the image and caches. For cache-type levers, the fill run that populates the cache and the hit run that uses it were recorded separately. A fill run normally shows no gain, so improvement figures are always based on the hit run.

1.2 Overall results

How much each of three operating scenarios improved is what this table answers. The 226s in the cold row includes roughly 32s of partial effect from image pre-pull (C1); the warm and idle-return rows come from R1-R4 alone.

Table 2. Startup time change by scenario (g7e.2xlarge Spot, 2026-08-30)
Scenario Baseline R1+R2+R4 (node-local cache) R3 + C1 pre-pull Improvement
Cold (from node provisioning) 428s (7 min 8 s) 306s (R1+R2, cache miss) 226s (3 min 46 s, R3 hit) -47%
Warm restart (same node) 314s 133s (2 min 13 s) 133s -58%
Idle → serving return 314s (restart) 0.97s (R4 wake) 0.97s about 320x

Attributed by stage, weight load went from 127.6s to 19.8s, 6.5x faster (R1), and engine initialization including compile fell about 68% from 94.0s to 29.6s on a cache hit (R2, R3). The idle return is the result of R4 replacing the restart itself.

1.3 Why past measurements are not compared directly

Even with the same configuration, a change in hardware generation shifts the per-stage baselines. In the 2026-08-05 L40S (g6e.2xlarge, 20Gbps) measurement, baseline cold was 537s, weight load was 149s, and 29-32s with the streaming loader applied. On this g7e (50Gbps), the same loader produced 19.8s. So every improvement rate in this article is claimed only within the same-environment re-measurement, and past numbers are mentioned only as background. The full L40S-based PoC is covered in the earlier article.

02Cold Start Anatomy - Four Phases and Lever Mapping

"Startup takes 7 minutes" alone does not tell you what to fix. This section splits the baseline cold start of 428 seconds into phases and maps each phase to the lever that attacks it.

2.1 Phase breakdown of the baseline configuration

What to look for in this table is where the longest phase is. Weight loading and engine initialization, which includes compilation, add up to 221.5 seconds, more than half of the total. Unlike the node and image phases, these two repeat unchanged even when only the pod is recreated on the same node.

Table 3. Phase breakdown of the 428s baseline cold start (Mountpoint FUSE + default loader, no cache)
Phase Measured Measurement basis Lever
Node provisioning 30s Karpenter NodeClaim created → node Ready C2 pre-provisioned node pattern (conditional)
Image pull 65.1s kubelet Pulled event, 8.9GB C1 pre-pull → 32~40s (conditional)
Weight loading (S3 → GPU) 127.6s vLLM log Loading weights took R1 streaming loader direct from S3 → 19.8s
Engine initialization (includes torch.compile 50.8s) 93.9s vLLM log init engine took R2 + R3 cache → 29.6~30.4s
Other (scheduling, probe intervals, etc.) about 111s Total startup minus the four phases above -
Total (pod created → Ready) 428s pod conditions

The remaining roughly 111 seconds is the sum of vLLM process initialization before weight loading begins (about 39 seconds), API server startup after engine initialization (about 46 seconds), pod scheduling wait (about 15 seconds), pre-start container preparation (about 4 seconds), and error at probe-period granularity (about 7 seconds). This experiment did not treat this remainder as a separate lever.

flowchart TB N["Node provisioning<br/>30s"] --> P["Image pull<br/>65s"] --> W["Weight loading<br/>127.6s"] --> I["Engine initialization (incl. compile)<br/>94s"] --> R(["Ready"]) C2["C2 pre-provisioned node pattern<br/>conditional"] -.-> N C1["C1 image pre-pull<br/>65s → 32~40s"] -.-> P R1["R1 streaming loader direct from S3<br/>127.6s → 19.8s"] -.-> W R23["R2 + R3 compile cache<br/>94s → 29.6~30.4s"] -.-> I
Figure 1. The four cold start phases and lever mapping. Solid lines are the startup order; dotted lines are the levers that shorten that phase. Each lever acts only on its own phase, so it can be applied independently and measured independently.

2.2 Why the 314s warm restart does not shrink

Recreating only the pod on the same node removes node provisioning, scheduling wait, and image pull. The baseline warm restart is 314 seconds. The 114-second gap from the 428-second cold start almost exactly matches the removed node provisioning plus scheduling wait (45 seconds) and image pull (65 seconds). Weights at 127.8 seconds and compilation at 51.0 seconds did not shrink at all.

There are two causes. Mountpoint for Amazon S3 (a FUSE client that mounts an S3 bucket like a file system) reads the weights from S3 again on every startup. The torch.compile cache defaults to /root/.cache inside the container, so it disappears when the pod terminates. In the default configuration, a restart means a recompile.

03The Stage-by-Stage Experiment Ladder - One Lever at a Time, Same Environment

To attribute the improvement to individual levers, only one thing can change at a time. This section explains how the manifests were stacked from Stage 0 to Stage 5 and how the phases were measured.

3.1 Stage 0 through 5

What to look for in this table is that each Stage differs from the previous one by exactly one lever. Stages 0 through 3 form a linear ladder, Stage 4 is a separate A/B of the node-layer lever, and Stage 5 is a branch off Stage 2. All Deployments share the same name and use the Recreate strategy, so switching Stages is a single kubectl apply.

Table 4. Stage-by-stage experiment ladder and measured results from 2026-08-30
Stage Added lever (one vs. previous) Target phase Measured result
0 Baseline Mountpoint FUSE mount + default loader, no cache Reference point Cold 428s, warm 314s
1 runai_streamer direct from S3 + env AWS_REGION Weight loading 127.8s Weights 19.8s, warm 204s
2 Persist VLLM_CACHE_ROOT on a hostPath Initialization 94s (includes compile 51s) Hit run: compile 6.6s, initialization 29.6s, warm 133s. Cold on a new node 306s (miss)
3 sleep mode (--enable-sleep-mode, gpu-memory-utilization 0.85) The restart itself sleep 12.8s, wake 0.97s. Startup stays at 133s with the cache hit intact
4 (separate A/B) Pre-pull the image in EC2NodeClass userData Image pull 65s pull 32.2s / 39.8s (n=2), "already present" did not fire
5 (branch off Stage 2) initContainer preloads the compile cache from S3 to the hostPath Cache miss on a new node compile 6.98s hit on cold, total 226s

3.2 How the phases were divided

The k8s-side phases are computed from the timestamps of pod conditions (PodScheduled, Ready) and events (Pulling, Pulled, Started). The vLLM-side phases are read from marker lines in the container log. The marker lines are preserved verbatim. The harness extracts the markers below and keeps them next to the result JSON.

Measurement harness - extracting phase markers from the vLLM log
kubectl -n serving logs "$POD" > results-stages/"$LABEL".log
grep -nE 'Loading weights took|Model loading took|init engine|Compiling a graph|graph capture|Application startup complete|Starting vLLM' \
  results-stages/"$LABEL".log > results-stages/"$LABEL".markers

# Of the markers captured in the baseline cold run (stage0-cold), the three lines used to compute the phases
# [default_loader.py] Loading weights took 127.63 seconds
# [backends.py] Compiling a graph for compile range (1, 8192) takes 32.61 s
# [core.py] init engine (profile, create kv cache, warmup model) took 93.90 s (compilation: 50.84 s)

The raw markers are kept as the evidence for tracing later which line the "compile 50.8s" value came from. The compilation value inside the parentheses of the engine initialization marker is the compile column in this article, and the outer value is the full initialization column.

3.3 Three measurement rules

  • For cache-type levers, the populate run and the hit run are distinguished by label (stage2-warm-1st, stage2-warm-2nd). A hit is double-checked by a sharp drop in the compile phase and by the size of the cache directory.
  • Runs where a container restart is detected are discarded. After a restart, startedAt is the restart time, which distorts the phases. The harness records restartCount in the result.
  • The instance type and capacity type (Spot/On-Demand) are recorded alongside every result. NIC bandwidth governs the weight loading phase, so figures without these values are not used for comparison.

This campaign ran each scenario 1~2 times. Claiming reproducibility within ±10% would require n≥3, so the improvements below should be read as evidence of direction and magnitude, but not with decimal-point precision.

04Recommendations R1-R4 - Levers Verified by Measurement

All four levers in this section were measured for effect in the same environment. For each lever, the measured value, how to apply it, the implications for the EKS architecture, and the conditions under which it holds are laid out in the same order. The order of application is R1 through R4, as listed.

Note - Premise P0, weights staged once in S3 within the Region

The recommendations below assume the model weights are already in an S3 bucket in the same Region. They are downloaded from Hugging Face once at onboarding and uploaded with s5cmd sync. A configuration where the serving pod loads directly from Hugging Face is not recommended. Every cold start re-downloads tens of GB from the internet. In a private subnet, this traffic goes through NAT. The download cache also lives inside the container, so it disappears when the pod is recreated. All weight figures in this article cover the S3-to-GPU stage.

4.1 R1 - Load weights directly from S3 with a streaming loader instead of a FUSE mount

The 127.6s weight load was not a bandwidth problem. Reading 31.22GiB (about 33.5GB) in 127.6s is an effective rate of about 2.1Gbps, far below the 50Gbps NIC of g7e.2xlarge. The bottleneck was the FUSE path itself, which reads as a single stream.

RunAI Model Streamer, the open-source loader bundled with vLLM (--load-format=runai_streamer), takes an s3:// path directly and performs parallel range reads. On the same bucket and the same weights, 127.6s dropped to 19.8s, 6.5 times faster, at an effective bandwidth of about 13.6Gbps. Initialization (94.4s, including the 51.1s compile) did not change at this stage, so the single-variable isolation holds.

Deployment - vLLM container args and env (R1)
containers:
  - name: vllm
    image: vllm/vllm-openai:v0.26.0
    args:
      - --model=s3://<model-bucket>/Gemma-4-31B-IT-NVFP4/   # s3:// specified directly instead of the FUSE path (/data/...)
      - --load-format=runai_streamer
      - '--model-loader-extra-config={"concurrency":64,"memory_limit":25769803776}'  # 24GiB buffer, sized for 2xlarge (64GiB RAM)
      - --served-model-name=gemma4-31b
      - --max-model-len=8192
    env:
      - name: AWS_REGION            # Required dependent env for direct s3:// access (Region specified explicitly)
        value: ap-northeast-2

concurrency and memory_limit use node RAM as a CPU staging buffer. Both values must be adjusted together when the instance type changes, so it is worth leaving the recommended values per instance type as comments in the manifest.

There are four implications for the EKS architecture.

  • Credentials are granted through EKS Pod Identity. S3 read permission is attached directly to the pod's service account, and no permission is added to the node IAM role. This keeps least privilege at the pod level.
  • NIC bandwidth becomes the new limit. The load took 29-32s on an L40S node (20Gbps burst) and 19.8s on g7e (50Gbps). The environments differ, so factors other than the NIC are mixed in, but choosing a node on GPU specs alone overlooks load time.
  • Secure an S3 gateway endpoint path. This prevents NAT gateway processing charges for the full weight size on every restart.
  • Mountpoint S3 CSI is not removed; its role is reduced to access for auxiliary files (draft model, tokenizer).

4.2 R2 - Persist the torch.compile cache on the node, outside the container

At startup, vLLM compiles the graph with torch.compile and captures CUDA graphs. These artifacts are cached under VLLM_CACHE_ROOT, but the default location is inside the container, so they disappear every time the pod is recreated. Of the 204s warm restart with Stage 1 applied, the 94s initialization (51s of it compile) was repeated every time for this reason.

Moving VLLM_CACHE_ROOT to a hostPath (a volume that mounts a directory on the node disk directly into the pod) makes the cache hit from the second start onward. On the hit run, compile went from 50.9s to 6.6s and total initialization from 94.0s to 29.6s, a reduction of about 68%. The full warm restart went from 204s to 133s. The populating run (first start) stays at 204s with no gain, which is expected.

Deployment - cache env and hostPath volume (R2)
containers:
  - name: vllm
    env:
      - name: VLLM_CACHE_ROOT       # Mounted path instead of the default /root/.cache
        value: /vllm-cache
    volumeMounts:
      - name: vllm-cache
        mountPath: /vllm-cache
volumes:
  - name: vllm-cache
    hostPath:                        # Cache lifetime = node lifetime. Gone when the node is reclaimed
      path: /var/cache/vllm
      type: DirectoryOrCreate

This lever costs almost nothing to configure, but its limit is clear. The cache is node-local, so it disappears when the node changes through Karpenter consolidation or a Spot interruption. A new-node cold start is still 306s even with R1 and R2 applied, and the 51.1s compile comes straight back. R3 resolves this limit.

Baseline warm restart 314s
+ R1 streaming loader 204s
+ R2 cache hit 133s
Figure 2. Attribution of the two levers in a same-node warm restart. R1 removed 110s and R2 removed 71s, and the two savings came from different stages.

The cache key is a contract. vLLM's cache key includes the model path, compile-related configuration, and the vLLM version. In an earlier measurement (2026-08-05, L40S), a cache populated under the /data path missed the moment the model path was switched to s3://. Stage 0 and Stage 1 of this ladder did not persist the cache, so that transition was not observed directly this time.

Conversely, in this re-measurement, adding --enable-sleep-mode and changing gpu-memory-utilization kept the hit. This means the key contains only configuration that affects compilation, and other flags are not included. Pin the deployment configuration, and record in the release procedure that a path change comes with a cold compile.

4.3 R3 - Distribute the compile cache through S3 so new nodes hit too

The R2 cache disappears when the node changes. But this cache is not large. The measured size was 218MB across 1,204 objects, and downloading it from in-region S3 takes a few seconds. Compared with 51 seconds of compilation, moving the cache is far cheaper.

In Stage 5, an initContainer (a setup container that runs before the main container) downloads the cache from S3 into the hostPath, and then vLLM starts. On a new-node cold start this produced a 6.98s compile hit, full initialization took 30.4s, and total cold start was 226s. A cache-miss run on a different new node under the same prepulled NodeClass conditions was 297s, so the total startup difference is 71s.

Not all of these 71s are the R3 effect. The initialization segment attributable to R3 dropped from 94.3s to 30.4s, about 64s, and the remaining roughly 8s is run-to-run variance from the image pull changing from 39.8s to 32.2s. The 80s figure against the standard NodeClass cold start of 306s includes the partial effect of image prepull (C1).

Deployment - cache preload initContainer (R3)
initContainers:
  - name: cache-preload
    image: amazon/aws-cli:latest
    command: ["/bin/sh", "-c"]
    args:
      - |
        PFX="s3://<model-bucket>/vllm-cache/v0.26.0-nvfp4/"   # put the vLLM version and config identifier in the prefix
        N=$(aws s3 ls "$PFX" --recursive 2>/dev/null | wc -l)
        echo "[cache-preload] source objects: $N"           # 0 means a silent miss. Always log it
        aws s3 sync "$PFX" /vllm-cache/ --only-show-errors || true   # continue startup even on failure (cold compile fallback)
        du -sh /vllm-cache || true
    env:
      - name: AWS_REGION
        value: ap-northeast-2
    volumeMounts:
      - name: vllm-cache
        mountPath: /vllm-cache

Publishing the cache to S3 is a separate procedure. Run it once after the first start of that configuration completes, and the prefix string must match exactly what the initContainer reads.

Cache publish - run once after the first start (the seeding run)
kubectl -n serving exec deploy/gemma4-31b -- \
  aws s3 sync /vllm-cache s3://<model-bucket>/vllm-cache/v0.26.0-nvfp4/

# if the vllm-openai image has no aws cli, run from a separate pod that mounts the hostPath
# measured: 218M /vllm-cache, uploaded objects 1204

This lever is what lets a Spot-first NodePool strategy and the cache strategy coexist. Only when the node is replaced by one of the same architecture is the compile cost expected not to return after a Spot interruption. That expectation is extrapolated from the new-node hit measurement (cold 226s); the Spot interruption fallback path itself was not measured.

flowchart TB subgraph A["GPU node A - first start (cache miss)"] VA["vLLM start<br/>compile 51s"] -->|"cache write"| HA["R2 hostPath<br/>/var/cache/vllm"] end HA -->|"publish once (prefix-scoped PutObject)"| S[("S3 vllm-cache/<br/>218MB, 1,204 objects")] S -->|"R3 preload (a few seconds)"| IC["initContainer<br/>aws s3 sync"] subgraph B["GPU node B - new or Spot replacement"] IC --> HB["hostPath<br/>preloaded"] --> VB["vLLM start<br/>compile 6.98s hit"] end
Figure 3. Lifting cache lifetime from the container to the node, and from the node to S3. R2 survives pod recreation (warm 133s), and R3 survives node replacement (cold 226s). If the preload fails, it falls back to cold compile, so startup is not blocked.

Four conditions must hold.

  • Put the vLLM version and configuration identifier in the S3 prefix, and republish when the configuration changes.
  • Separate the publish-side write permission into an s3:PutObject scoped to that prefix. The serving credentials stay read-only.
  • The initContainer tolerates failure but logs the source object count. An s3 sync against an empty prefix transfers nothing and exits 0, so without the log there is no way to notice a miss.
  • Portability across GPU architectures is unverified. This measurement only confirmed porting from g7e to g7e (Blackwell). If the NodePool mixes in g6e (Ada) as a Spot fallback, split the prefix per architecture until that is verified.

4.4 R4 - Switch between idle and active with sleep/wake

When you want to free GPU memory during periods with no requests, the option so far has been to scale replicas down to 0. Coming back takes the cold path, 226 seconds. vLLM sleep mode releases only GPU memory while keeping the process and compile state. Level 1 keeps the weights in CPU RAM, so waking only moves the weights back to the GPU, with no S3 reload or recompilation.

In measurement, POST /sleep?level=1 took 12.8s and POST /wake_up took 0.97s. Inference latency right after wake was 0.30s, nearly the same as the 0.28s before sleep, which confirmed consistency. Against a 133s warm restart, that is about 137 times faster.

sleep/wake measurement - run after port-forward
kubectl -n serving port-forward svc/gemma4-31b 8000:8000 &
time curl -sX POST 'localhost:8000/sleep?level=1'   # release GPU memory, keep weights in CPU RAM (measured 12.8s)
time curl -sX POST 'localhost:8000/wake_up'         # resume (measured 0.97s)
curl -s localhost:8000/v1/models                    # confirm inference is available
Caution - enabling sleep mode together with gpu-memory-utilization 0.90 makes startup fail

The cumem allocator that sleep mode forces miscomputes non-torch memory as a negative number. The g7e measurement log recorded -4.04 GiB for non-torch memory, and as a result the KV cache sizing exceeded the budget by about 1GiB (56.77 GiB used vs 55.68GiB allowed) and the engine fell into a crash loop. When used together with sleep, it is mandatory to either set gpu-memory-utilization to 0.85 or use the fixed --kv-cache-memory value that vLLM suggests in its log.

/sleep and /wake_up are development endpoints opened by VLLM_SERVER_DEV_MODE=1. Their exposure must be controlled with Service and NetworkPolicy.

flowchart LR SL["Sleep (level 1)<br/>GPU released, weights kept in CPU RAM"] SV["Serving<br/>GPU held, inference running"] Z["Scale-to-zero<br/>node released, node cost 0"] SV -->|"sleep 12.8s"| SL SL -->|"wake 0.97s"| SV SV -->|"replicas 0"| Z Z -->|"cold 226s"| SV
Figure 4. The idle strategy splits into two layers. Short idle periods go to Sleep (0.97s resume, node billing continues), and long idle periods such as overnight go to Scale-to-zero (226s resume, cost 0).

GPU instance billing continues even while sleeping. If T is the expected length of the idle window and C is the node's hourly rate, sleep pays T×C in idle cost and resumes in 0.97s, while scale-to-zero pays no idle cost and resumes in 226s. The decision criterion is whether the SLO penalty for resume latency exceeds that difference. Gather demand-pattern data first, then decide.

05Conditional recommendations and non-recommendations

There were other levers we examined beyond R1-R4. Two hold only under specific operating patterns and were left as conditional, and three were excluded after review. Leaving the exclusion reasons on record means the judgment does not have to be repeated when the same question comes up again.

5.1 C1 - Image pre-pull confirmed only a partial effect

We ran an A/B test on the hypothesis that pulling the vLLM image in the background from EC2NodeClass userData right after node boot would shorten the kubelet pull. The result was a partial effect. The standard NodeClass's 64-65s dropped to 32.2s and 39.8s (n=2) on the pre-pull NodeClass.

The "already present" event, which would mean a 0s pull, did not appear in either run. Karpenter schedules the pod as soon as the node becomes Ready, so the userData pre-pull and the kubelet pull contend for the same image. containerd shares the layers, so only about half is saved. A 0s pull is possible only in the pattern where the node exists before the workload (C2).

EC2NodeClass userData - best-effort pre-pull (C1)
#!/bin/bash
# Wait until the containerd socket opens, then pull in the background. Node join proceeds even on failure
(
  for i in $(seq 1 60); do
    [ -S /run/containerd/containerd.sock ] && break
    sleep 5
  done
  ctr -n k8s.io images pull docker.io/vllm/vllm-openai:v0.26.0 >>/var/log/vllm-prepull.log 2>&1
) &

In an environment that needs to cut about 30 more seconds, there is no harm in turning it on. However, if the image tag in userData and the tag in the Deployment diverge, the pre-pull becomes void and the pull silently falls back to 65 seconds. Tag synchronization has to be part of the deployment procedure. ECR pull through cache, an in-Region mirror, is a candidate for cutting the remaining 32 seconds further, but we did not measure it this time.

5.2 C2 - Decide cache-node retention and warm pool from demand data

Extending the NodePool's consolidateAfter to retain idle GPU nodes, or a warm pool that keeps nodes always available with low-priorityClass pause pods, is the only structural lever that turns a cold start into a warm one. The price is idle cost: retention time multiplied by the node unit price.

This article's recommendation is not to decide without the distribution of restart intervals. Multiply the hit rate by the latency saving (226s - 133s = 93s), convert it to an SLO penalty amount, and find from data the point where that amount exceeds the retention cost. Since R4 achieves the same goal more cheaply within a single GPU, a warm pool holds when you are preparing for multi-replica scale-out.

5.3 Non-recommendations X1-X3

What to see in this table is that all three items were excluded without being measured. The reason for judging without measurement is that in each case an alternative lever achieved the same goal with less overhead. They are subject to re-review if conditions change.

Table 5. Levers excluded after review, with reasons
ID Item Reason for exclusion Re-review condition
X1 SOCI lazy loading LLM serving actually reads most layers at startup, so the lazy gain is limited. There is a risk that the pull cost is deferred into the weight-load stage and only appears faster, and the operational burden of a non-standard snapshotter outweighs the saving. When the image stage remains the main bottleneck
X2 Weight EBS pre-bake R1 is already at 19.8s, so the marginal benefit is low. The snapshot must be re-baked on every model update, losing the advantage of S3 as the single source of truth. When a seconds-level SLO is attached to the weight stage
X3 Compile cache EBS pre-bake R3 (S3 preload, 218MB) achieves the same goal with far less overhead. Snapshot freshness management and a review of lazy restore latency would be added. When seconds-level startup with no initContainer stage at all is required

06Operating rules - the traps the experiment taught

What outlasts the numbers are the traps we stepped on during the experiment. This section summarizes the assumptions the re-measurement corrected and the five operating rules that came out of them.

6.1 Assumptions corrected by re-measurement

What to see in this table is how items classified as "Measured" and items that had remained estimates or hypotheses changed once measured in the same environment. F-1 turned out to be an actual startup failure, and F-2 corrects what we had gotten wrong about the cache key scope. F-3 to F-6 are refinements of numbers, and F-7 and F-8 are hypotheses confirmed by measurement.

Table 6. Eight things the 2026-08-30 re-measurement corrected
# Item Previous assumption Re-measurement result
F-1 sleep mode safety "Measured" Startup fails when combined with gpu-memory-utilization 0.90. 0.85 required. Production manifest fixed
F-2 compile cache key Miss on model path and flag changes Hit persists across sleep flag and gmu changes. The key includes only compile-related configuration
F-3 Cold start of the improved configuration Conflicting estimates of about 4.5 min vs about 7 min Settled by measurement at 306s (5 min 6 s)
F-4 sleep / wake time 26.8s / 3.6s (L40S) 12.8s / 0.97s on g7e
F-5 Baseline warm restart Not measured (estimated about 400s) Measured at 314s
F-6 Streaming loader effective bandwidth 29-32s (L40S, 20Gbps) 19.8s on g7e (50Gbps), about 13.6Gbps
F-7 Image pre-pull Hypothesis of 0-82s net effect 64-65s → 32-40s (n=2). A 0s pull needs the node-first pattern
F-8 Cache S3 preload Working hypothesis Compile hit in 6.98s on a new-node cold start, 226s total. Portability across the same architecture holds

6.2 Five operating rules

  1. "Measured" is a property of a configuration combination. The intersection of sleep mode (verified) and gpu-memory-utilization 0.90 (verified) was unverified, and it actually broke. Stage-by-stage A/B that stacks levers one at a time is the safeguard that forces this combination to be measured at least once.
  2. The cache key is a contract. If any one of model path, compile configuration, or vLLM version changes, it is a cold compile. Write in the release notes whether this deployment comes with a cache miss.
  3. Measure silent failures. An s3 sync against an empty prefix (exit 0), a pre-pull tag mismatch, and Ready=True on a pod that is Terminating all raise no error and only revert performance to its old value. The measurement harness needs stage decomposition, a distinction between populate and hit runs, and restart detection for these failures to become visible.
  4. Hardware generation changes the baseline. Even with the same configuration, per-stage times differed by NIC and GPU generation. Claim improvement rates only from re-measurement in the same environment.
  5. In a NodePool with mixed architectures (Spot fallback), budget for a cold compile on the fallback node until compile cache portability is verified.

07Adoption decision table

Which levers to apply, and how far, is decided by the operating pattern. What to look for in this table is the one row that matches your own operating situation. Four common situations are mapped to a recommended combination and its measured basis.

Table 7. Recommended combinations and expected effect by operating situation
Our environment Recommended combination Expected effect (measured basis)
Restarts are frequent (deployments, repeated tuning) R1 + R2 Warm restart 314s → 133s
Mostly Spot, so nodes change often R1 + R2 + R3 (+ C1) Node-replacement cold start 428s → 226s (C1 included)
Demand is intermittent (idle periods exist) + R4 Wake in 0.97s. Long idle periods are tiered with scale-to-zero
Even a cold SLO in the 3-minute range is not enough Evaluate C2 With a node provisioned ahead, cold converges to warm (133s). C1's pull savings are already included in the 226s

The measurements also set the order of adoption. R1 comes first because it cuts the longest stage at the lowest difficulty, then R2 with no configuration cost, then R3 to stay compatible with the Spot strategy, and R4 after the demand pattern is confirmed.

Principle: Measure first which stage is long, add only that stage's lever one at a time, and measure again in the same environment. A lever added without measurement cannot claim an effect.

08Conclusion and remaining unmeasured items

In one sentence: fix the weight path (R1) and the compile cache lifetime (R2, R3), add image pre-pull (C1), and the cold start of 31B-class LLM serving on EKS drops from 428 seconds to 226 seconds, while the return from idle becomes 0.97 seconds with sleep/wake (R4). All four levers are combinations of existing vLLM and EKS features, so no additional components are introduced.

8.1 Final recommendations by layer

  • Weight transfer layer - demote the Mountpoint FUSE mount to auxiliary files and switch the startup path to a direct S3 read with runai_streamer. Put Pod Identity and an S3 gateway endpoint in place together.
  • Compile cache layer - move VLLM_CACHE_ROOT to a hostPath, publish the cache to S3, and preload it with an initContainer. Put the version and configuration identifiers in the prefix.
  • Process lifetime layer - split short idle periods to sleep mode and long idle periods to scale-to-zero. With sleep enabled, gpu-memory-utilization is 0.85.
  • Node and image layer - enable pre-pull but do not expect a standalone effect; decide on node retention and a warm pool after restart-interval data has accumulated.

8.2 What has not been measured yet

Three items remain unmeasured. The first is whether a compile cache built on g7e (Blackwell) is valid on a g6e (Ada) fallback node. It is the last gate before applying R3 to the Spot fallback path; if it fails, the cache is split into per-architecture S3 prefixes. The second is the warm hit rate of cache node retention and a warm pool by retention duration, which can only be judged once operational data accumulates. The third is whether the remaining 32s of image pull can be cut further with ECR pull through cache.

8.3 Appendix - measurement ledger behind the figures

This is the raw table behind the startup-stage figures and the sleep/wake figures in this article. What to look for in this table is which measurement run each figure in the body came from. Units are seconds, and "Init total" is the value of the vLLM init engine took marker including compile time. Bandwidth was calculated from the weight times in this table in decimal Gbps (31.22GiB is about 33.5GB), and the cache sizes, the crash-loop log, and the past L40S values follow the measurement records in the corresponding sections of the body.

Table 8. All measurements on g7e.2xlarge Spot, 2026-08-30 (unit: seconds)
Run Scenario Total startup Image pull Weights compile Init total Notes
stage0-cold Cold 428 65.1 127.6 50.8 93.9 Mountpoint, no cache. Node 30s
stage0-warm Warm 314 Cached 127.8 51.0 94.0 Weight and compile savings 0
stage1-warm Warm 204 Cached 19.8 51.1 94.4 +R1
stage2-warm-1st Warm (fill run) 204 Cached 19.3 50.9 94.0 +R2, the run that fills the cache
stage2-warm-2nd Warm (hit run) 133 Cached 19.1 6.6 29.6 +R2 hit
stage2-cold Cold 306 63.9 19.9 51.1 94.3 New node = cache miss. Node 29s
stage3-warm Warm (hit) 133 Cached 19.8 6.4 30.2 +sleep mode, gmu 0.85
stage5-cold-miss Cold (pre-pulled node) 297 39.8 20.9 51.2 94.3 R3 isolation control. Node 30s
stage5-cold-hit Cold (pre-pulled node, cache hit) 226 32.2 20.1 6.98 30.4 +R3 hit, partial C1 effect. Node 30s
stage3-sleepwake sleep → wake - - - - - sleep 12.8s, wake 0.97s, inference 0.28s → 0.30s

GPU usage totaled about 1.5 hours on Spot g7e. The afternoon campaign (Stage 0-3, including about 15 minutes of crash-loop diagnosis) took about 1 hour, and the evening campaign (Stage 4, 5) about 25 minutes.

Full image of the interactive architecture map - weights flow directly from the S3 model bucket through the gateway endpoint to the vLLM pod on the GPU node, the compile cache moves between hostPath and S3, and Pod Identity supplies S3 read credentials
Figure 5. Full view of the interactive architecture map. Click the image to open the interactive version ↗ with node exploration, path tracing, and dark/light themes.

--References

Primary sources

  • Gemma-4-31B vLLM Serving PoC Benchmark - this blog (2026-08-09). L40S baseline, g7e main verdict, and the first measurements of the startup-reduction A/B https://whchoi98.github.io/docs/techblog/aiml/gemma4-vllm-serving-benchmark/
  • Loading models with Run:ai Model Streamer - vLLM documentation. --load-format runai_streamer, S3 paths, concurrency and memory_limit options https://docs.vllm.ai/en/latest/models/extensions/runai_model_streamer.html
  • vLLM environment variables - vLLM documentation. VLLM_CACHE_ROOT, VLLM_SERVER_DEV_MODE https://docs.vllm.ai/en/latest/configuration/env_vars.html

AWS documentation

Karpenter and external material

  • Karpenter NodeClasses - EC2NodeClass userData (C1 pre-pull), amiSelectorTerms, blockDeviceMappings https://karpenter.sh/docs/concepts/nodeclasses/
  • Karpenter Disruption - consolidation and consolidateAfter (C2 node retention) https://karpenter.sh/docs/concepts/disruption/
  • soci-snapshotter - awslabs GitHub. Reference when evaluating X1 https://github.com/awslabs/soci-snapshotter