Observability / Platform Deep Dive

Amazon Bedrock LLM Monitor - 37개 LLM 채널 상시 계측 플랫폼 구조 분석

같은 모델이라도 어느 경로로 호출하느냐에 따라 속도, 비용, 지원 기능이 달라집니다. Bedrock 추론 프로파일, Anthropic Claude Platform on AWS, OpenAI GPT via Bedrock Mantle을 한 화면에서 비교하는 model-monitoring 프로젝트(v2.19.2)의 프로브 파이프라인, 패리티 스윕 메커니즘, 운영 방식을 저장소 코드 기준으로 분석합니다.

작성 기준일은 2026-08-09입니다.

분석 대상은 frontend/src/lib/version.ts 기준 model-monitoring 저장소 v2.19.2입니다.

핵심 카탈로그 정의는 backend/prober.py:AVAILABLE_MODELSbackend/parity/catalog.py입니다.

주 출처는 GitHub 저장소 whchoi98/model-monitoring과 저장소 내 docs/architecture.md, ADR-001~024입니다.

요약

01문제 정의 - 무엇을 왜 측정하는가

이 절은 프로젝트가 풀려는 문제를 정리합니다. 같은 모델을 여러 경로로 불러서 계속 재야 하는 이유가 핵심입니다.

같은 Claude 모델이라도 호출 경로에 따라 다른 서비스가 됩니다. 경로는 네 갈래입니다. Bedrock Global 추론 프로파일(global.*), Bedrock US 프로파일(us.*), Anthropic Claude Platform on AWS(제공사가 직접 호스팅하는 endpoint), OpenAI GPT via Bedrock Mantle입니다. 추론 프로파일은 Bedrock이 요청을 여러 리전으로 분산해 주는 호출 경로를 말합니다.

경로마다 TTFT(요청 후 첫 토큰이 도착할 때까지의 시간), 처리량, 가격, 지원 기능이 다릅니다. 그 차이는 리전 상황과 모델 버전에 따라 계속 변합니다. 그래서 운영자가 "이 워크로드는 어느 채널로 태울 것인가"를 결정하려면 동일 조건 병렬 실측이 필요하다는 것이 이 프로젝트의 출발점입니다.

두 번째 문제는 기능 지원 매트릭스입니다. tool use(모델이 외부 도구를 호출하는 기능), 캐싱(반복되는 입력을 저장해 재사용하는 기능), structured output(정해진 JSON 형식으로만 답하게 하는 기능)을 어느 채널이 지원하는지, 제공자 문서는 채널별 차이를 다 말해주지 않습니다. 요청한 파라미터가 조용히 무시되는 경우도 있습니다.

ADR-021(저장소의 아키텍처 결정 기록 문서)은 v2.10.0까지 쓰던 수작업 스크린샷 증명 방식이 카탈로그 확장과 함께 유지 불가능해졌다고 기록합니다. 그래서 지원 여부 자체를 주기적으로 실행해서 증명하는 패리티 런이 추가되었습니다.

그렇다면 측정 대상은 몇 개일까요? v2.19.1에서 42개가 37개로 조정되었습니다. OpenAI 1P direct 경로(Path 5, 5개 채널)는 사용자 결정으로 화면에서 제외되었습니다. 다만 코드와 DB 행은 보존하고, 3중 스위치(CDK ENABLE_OPENAI_1P=false, backend visibility.py 조회 필터, frontend EXCLUDED_FAMILIES)로 노출만 껐습니다.

아래 표에서 볼 것은 37개 채널이 어느 제공 경로에 몇 개씩 속하는지입니다.

표 1. 활성 37개 채널 구성 (backend/prober.py, frontend TrendChart.tsx 주석 기준)
채널 그룹채널 수구성
Bedrock 추론 프로파일17개Claude 8종 × Global/US 프로파일 16개 + Nova 2.0 Lite (US) 1개
Anthropic CP on AWS7개Fable 5, Opus 5/4.8/4.7, Sonnet 5/4.6, Haiku 4.5 - 기동 시 /v1/models 자동 발견
OpenAI via Bedrock Mantle13개GPT 5.4(3리전), 5.5(2리전), 5.6 Sol(2리전)/Terra(3리전)/Luna(3리전)
OpenAI 1P direct5개 (휴면)v2.19.1부터 비노출 - 코드/DB 보존, 등록 skip

02아키텍처 - 프로브 파이프라인과 8개 CDK 스택

이 절은 시스템이 어떻게 구성되어 있는지 다룹니다. 재는 부분과 보여주는 부분이 완전히 분리되어 있다는 점이 핵심입니다.

2.1 서비스 경로

사용자가 대시보드를 여는 경로는 다음과 같습니다. CloudFront VPC Origin → 내부 ALB(HTTPS:443) → ECS Fargate 서비스 2개(FastAPI backend, Next.js standalone frontend) → RDS PostgreSQL 16(t4g.micro, Single-AZ)입니다. Fargate는 서버를 직접 관리하지 않고 컨테이너를 실행해 주는 AWS 서비스입니다.

ALB를 인터넷에 직접 노출하지 않고 CloudFront VPC Origin으로 감싼 것은 ADR-001의 결정입니다. 모든 외부 인입은 HTTPS만 허용합니다. 배포 리전은 ap-northeast-2(서울)입니다.

2.2 측정 파이프라인

측정 파이프라인은 서비스 경로와 완전히 분리되어 있습니다. v1에서는 auto-prober가 backend 프로세스 안의 daemon thread였습니다. v2에서는 EventBridge Scheduler(정해진 주기에 작업을 실행해 주는 AWS 스케줄러)가 주기마다 일회성 Fargate 태스크를 RunTask로 띄우는 구조로 바뀌었습니다(ADR-003).

코드도 이 분리를 따릅니다. backend의 auto_prober.pyrun_cycle() 함수만 내보내고, auto_prober_runner.py가 CLI 엔트리포인트(--once)를 맡습니다. 프로브 상태 API도 in-process 상태가 아니라 DB의 최근 ProbeRun 행을 source of truth(단일 기준 데이터)로 씁니다.

flowchart LR EB["EventBridge Scheduler"] -->|"rate 5분"| AP["AutoProber Task"] EB -->|"rate 5분"| IN["Insights Task"] EB -->|"rate 12시간"| PR["ParityRun Task"] EB -->|"rate 15분"| GB["GptBench Task"] AP --> CH["37개 채널 프로빙"] CH --> B["Bedrock Runtime"] CH --> A["Anthropic CP on AWS"] CH --> M["Bedrock Mantle OpenAI"] AP --> DB[("RDS PostgreSQL 16")] IN --> DB PR --> DB GB --> DB DB --> BE["FastAPI backend"] BE --> FE["Next.js 대시보드"]
그림 1. 프로브 파이프라인. EventBridge Scheduler가 네 종류의 일회성 Fargate 태스크를 주기 실행하고, 대시보드는 태스크가 적재한 DB만 읽습니다. 측정과 조회가 분리된 것이 이 구조의 핵심입니다.

아래 표에서 볼 것은 네 개 스케줄의 실행 주기와 각 태스크가 맡은 일입니다.

표 2. EventBridge 스케줄 4개 (cdk/lib/stacks/scheduler-stack.ts 기준)
스케줄주기태스크 명령역할
AutoProberSchedulerate(5 minutes)python -m auto_prober_runner --once37개 채널 × 워크로드 1종 프로빙
InsightsSchedulerate(5 minutes)python -m insights_runner --window 6hSonnet 4.6으로 최근 6시간 요약 생성
ParityRunSchedulerate(12 hours)python -m parity_runner --once모델 × surface × 피처 실행 증거 스윕
GptBenchSchedulerate(15 minutes)python -m gptbench_runner --onceMantle GPT 8채널 × 10회 TTFB/TTFT 벤치
참고 - 문서와 코드가 어긋나는 지점은 코드 기준으로 적었습니다

docs/architecture.md는 EventBridge 스케줄을 3개로 기술합니다. 그러나 scheduler-stack.ts에는 v2.18.0에서 추가된 GptBench까지 4개가 정의되어 있습니다.

또 저장소 루트의 config.yaml(모델 4개, SQLite, us-east-1)은 v1 잔재로, 현재 backend / CDK 코드 어디에서도 참조하지 않습니다. 실제 프로브 주기는 config가 아니라 EventBridge 스케줄 정의가 결정합니다.

2.3 인프라 스택 8개

인프라는 몇 개의 단위로 관리될까요? CDK v2 TypeScript 스택 8개입니다. Network(VPC, NAT GW, PrivateLink 엔드포인트 9+1개), Data(RDS, Secrets, SSM), Cluster(ECS 클러스터, ECR), AgentCore(챗봇 메모리), AppServices(Fargate 2개, ALB), Edge(CloudFront, WAF), Scheduler(스케줄과 태스크 정의), Observability(알람 7개, 대시보드, SNS) 순으로 의존 관계를 따라 배포합니다.

재사용 L3 construct(fargate-service.ts, pinned-image.ts)가 서비스 정의를 공유합니다.

03측정 지표와 워크로드 프리셋

이 절은 한 번의 측정에서 무엇을 어떤 조건으로 기록하는지 다룹니다. 모델에게 어떤 종류의 일을 시키느냐에 따라 성적이 달라지기 때문에, 일의 종류부터 정의합니다.

프로브 한 사이클은 37개 채널 전체에 워크로드 카테고리 하나를 적용합니다. 카테고리는 6종이고 사이클마다 라운드로빈(정해진 순서대로 돌아가며 선택)으로 회전합니다. 그래서 같은 카테고리는 30분(5분 × 6)마다 다시 측정됩니다.

정의는 backend/auto_prober.pyWORKLOAD_PRESETS가 source of truth입니다. 결과 행에는 probe_results.category 컬럼이 남아 카테고리별 필터링이 가능합니다.

아래 표에서 볼 것은 6종 카테고리가 각각 어떤 사용 패턴을 흉내 내는지입니다.

표 3. 워크로드 카테고리 6종 (backend/auto_prober.py WORKLOAD_PRESETS)
id라벨측정 의도
chat-short짧은 대화TTFT에 민감한 짧은 응답
reasoning추론복잡한 추론, 큰 max_tokens
code-gen코드 생성코드 출력 품질과 처리량
summarize요약긴 입력 → 짧은 출력
structuredJSON 추출텍스트 → JSON-only 추출
translate번역영한 기술 번역, 뉘앙스 보존

호출 하나에서는 몇 가지를 기록할까요? 여섯 가지입니다. TTFT(요청 → 첫 토큰, ms), Total Latency(요청 → 마지막 토큰, 클라이언트 측, ms), Server Latency(Bedrock이 보고하는 내부 처리 시간, 네트워크 오버헤드 제외, ms), TPS(첫 토큰 이후 출력 처리량, tok/s), 입출력 토큰 수, 그리고 stop reason(모델이 생성을 멈춘 이유, end_turn / max_tokens / tool_use 등 enum)입니다.

토큰 수는 backend/pricing.py의 모델별 단가 테이블과 결합합니다. 이것이 30일 비용 예측의 입력이 됩니다.

원칙: 지연 지표를 클라이언트 관측(TTFT / Total)과 서버 보고(Server Latency)로 분리해 두면, 채널 간 차이가 네트워크 경로 때문인지 모델 처리 때문인지 데이터로 구분할 수 있습니다.

04패리티 스윕 딥다이브 - 실행 증거 판정

이 절은 "이 채널이 이 기능을 지원하는가"를 어떻게 증명하는지 다룹니다. 호출이 성공했다는 사실만으로는 지원한다고 말할 수 없다는 것이 출발점입니다.

패리티 런의 설계 질문은 "지원 여부를 무엇으로 판정하는가"였습니다. ADR-021의 답은 HTTP 200은 판정 근거로 불충분하다는 것입니다. 파라미터가 조용히 무시되거나, 요청은 성공해도 기능이 실제로 동작하지 않는 경우가 흔하기 때문입니다.

그래서 backend/parity/ 패키지는 실제 API를 호출한 뒤 응답 내용의 증거 검사를 통과했을 때만 supported로 판정합니다.

4.1 매트릭스 크기와 증거 검사

스윕 범위는 얼마나 넓을까요? 모델 × API surface 6종 × 피처 19종입니다. API surface는 같은 모델을 호출하는 API의 종류를 말합니다.

surface는 converse, invoke_model, messages, messages_mantle, chat_completions, responses입니다(catalog.py:SURFACES). 피처는 basic / streaming / system_instructions / tool_use / structured_output / reasoning / caching / adaptive_thinking / count_tokens / batches / web_search / computer_use / reasoning_effort / json_schema / url_sources / memory_tool / code_execution / files_api / models_api 19종입니다.

ADR-021 초기 설계는 surface 5종 × 피처 7종이었습니다. ADR-022(Mantle Messages surface)와 ADR-023(피처 19종 확장)을 거쳐 현재 크기가 되었습니다.

증거 검사는 다음 다섯 가지입니다. 여기서 카나리는 미리 심어둔 표식이 응답에 나타나는지 보는 검사 기법을 말합니다.

  • 도구 카나리 왕복 - 도구 정의를 보내고 모델이 실제로 그 도구를 호출하는지 확인합니다.
  • 시스템 지시 카나리 - 시스템 프롬프트에 심은 표식이 응답에 반영되는지 확인합니다.
  • JSON 파싱 + 필수 키 - structured output이 유효한 JSON이고 요구한 키를 담는지 검사합니다.
  • cached-token 카운트 - 반복 요청에서 캐시 토큰 카운트가 0보다 큰지로 캐싱 동작을 증명합니다.
  • 스트림 델타 2개 이상 - 스트리밍이 실제 조각 단위로 도착하는지 확인합니다.

판정 로직은 engine.py의 순수 함수로 분리되어 단위 테스트 대상입니다. 결과는 supported / unsupported / broken / skipped 네 값으로 나뉩니다.

제공자가 "깨끗한 미지원 거부" 시그니처(unsupported_parameter 등)를 돌려주면 unsupported입니다. 그 외 오류나 증거 실패는 broken이고, 해당 없음(비 reasoning 모델의 reasoning 피처 등)은 skipped입니다. skipped를 unsupported와 구분하는 것이 ADR-023이 말하는 "정직한 제외"입니다.

run마다 결과와 함께 증거 JSON, 지연 시간, 오류가 parity_runs / parity_results 테이블에 남습니다. /parity 화면에서 셀을 클릭하면 증거 모달로 원본을 확인할 수 있습니다.

주의 - Broken 판정은 프로브 결함일 수도 있습니다

ADR-021이 스스로 기록한 사고입니다. 첫 실행에서 max_tokens=64 절단이 structured_output 전량을 false-Broken으로 만들었습니다. v2.11.1에서 피처별 토큰 예산(max_tokens_for)으로 수정되었습니다.

Broken 셀은 증거의 response_snippet으로 프로브와 모델 어느 쪽 결함인지 확인한 뒤에 신뢰해야 합니다.

4.2 멀티 채널 비교가 실제로 찾아낸 것

같은 검사를 채널별로 돌리면 문서에 없는 격차가 드러납니다. ADR-021이 기록한 실측 발견은 세 가지입니다. Mantle ChatCompletions surface의 전면 미지원(Responses API만 동작), GPT 5.4의 reasoning_tokens 미보고, Claude Fable 5 캐싱의 surface별 차이입니다.

비용은 어떨까요? GPT 5.6 세대는 Bedrock in-region 가격이 OpenAI 1P와 동일(parity)합니다. 반면 5.4 / 5.5는 10% 마크업이 있다는 사실이 카탈로그에 반영되어 있습니다.

05분석 화면 9개

이 절은 쌓인 데이터를 보는 화면들을 다룹니다. 목적별로 나뉜 9개 페이지가 하나의 대시보드를 이룹니다.

frontend는 Next.js 14 standalone이고, 공용 헤더(AppHeader.tsx)가 9개 페이지를 묶습니다. README의 프로젝트 구조 절에는 "6 routes"라고 남아 있지만, 실제 src/app/에는 루트(/)와 챗봇 전용 /chat을 포함해 라우트가 10개(디렉터리 9개) 있습니다. 그중 분석 화면이 9개입니다.

아래 표에서 볼 것은 각 화면의 경로와 그 화면이 답해 주는 질문입니다.

표 4. 분석 페이지 9개 (frontend/src/app/ 라우트 기준)
경로화면보여주는 것
/Dashboard프로브 상태 + 37개 모델 카드 + 지연/TPS 추이, 워크로드 필터
/modelsModel Explorer모델별 카드 + Converse/InvokeModel/Messages/Responses 코드 예제
/parityParity Run모델 × surface × 피처 매트릭스 + 증거 모달 + 수동 트리거
/gpt-on-awsGPT on AWSMantle GPT 8채널 TTFB/TTFT/GAP 벤치, 15분 주기
/costCost30일 비용 예측 + 모델별/채널별 비교
/reliabilityReliabilityfamily/채널별 성공률 + 오류 버킷
/efficiencyEfficiency카테고리별 가중 0~100 토큰 효율 점수
/analysisAnalysisstop reason 분포 + 출력 길이 히스토그램
/promptsPrompts프롬프트 세트 CRUD + Bedrock OptimizePrompt (인증 필요)

화면 외 인터페이스로는 Claude Sonnet 4.6 기반 챗봇이 있습니다. 4개의 커스텀 도구로 시계열 저장소를 조회해 자연어 질문에 답합니다. 대화 컨텍스트는 AgentCore Memory에 30일 보존됩니다.

GPT on AWS 페이지의 벤치는 별도 방법론을 씁니다. 약 55.8k 토큰의 고정 캐시 프롬프트로 채널당 10회 순차 호출합니다. TTFB(첫 스트림 이벤트까지의 시간), TTFT(첫 텍스트 델타), GAP(둘의 차이, thinking 근사)을 median / p95로 집계합니다.

06실제 운영 흐름

이 절은 이 플랫폼을 실제로 배포하고 굴리는 방법을 다룹니다. 저장소가 직접 겪은 사고와 그 대응이 함께 기록되어 있어, 같은 함정을 피하는 데 쓸 수 있습니다.

6.1 배포 절차

배포는 runbook(docs/runbooks/deploy.md)이 규정합니다. 먼저 make verify(CDK lint + typecheck + Jest 71개 + cdk-nag + ruff + pytest 91개 + frontend tsc)를 통과시킵니다.

그다음 arm64 컨테이너 이미지를 immutable tag(한 번 붙이면 내용이 바뀌지 않는 태그, v<timestamp>)로 빌드해 ECR에 push합니다. CDK deploy에는 이미지 URI를 @sha256:<digest>까지 고정해 넘깁니다. frontend 이미지는 RUM 관련 --build-arg가 빌드 타임에 필요합니다.

주의 - :latest 태그와 ECS 이미지 캐시의 조합

이 저장소가 실제로 겪고 ADR-010 / ADR-018로 남긴 사고입니다. :latest로 push하면 Docker layer dedupe와 ECS의 이미지 캐시가 겹쳐 새 코드가 반영되지 않은 채 배포가 성공한 것처럼 보입니다.

대응은 immutable tag + digest 고정이었습니다. 캐시가 이미 오염된 repository는 이름을 바꿔 (bedrock-monitor-backend-v2) 우회했습니다.

6.2 스케줄 잡의 조용한 실패

스케줄 잡의 조용한 실패도 runbook화되어 있습니다. EventBridge Scheduler role의 ecs:RunTask Resource는 task definition family의 :* wildcard여야 합니다(ADR-011). revision 번호를 박으면 새 revision 배포 후 권한 거부로 silent fail(오류 표시 없이 그냥 실행이 멈추는 실패)이 납니다.

이때는 EventBridge 지표가 비어 있어 디버깅이 어렵습니다. 진단 표지는 두 가지입니다. /api/auto-probe/statuslast_run_time이 수 시간 전이거나, /ecs/autoprober 로그 그룹에 5분 내 엔트리가 없는 경우입니다.

6.3 데이터 수명과 관측

데이터 수명 관리는 retention.py가 맡습니다. RETENTION_DAYS(기본 60일)를 초과한 원본 probe_results는 시간 단위 집계 테이블로 이관됩니다.

DB 마이그레이션은 backend 기동 시 lifespan에서 수행됩니다. pg_advisory_lock과 statement_timeout 30초를 걸고 ADD COLUMN IF NOT EXISTS로만 수행합니다. 그래서 다중 태스크가 동시에 기동해도 멱등(여러 번 실행해도 결과가 같음)입니다.

관측 계층은 CloudWatch 알람 7개(ALB 5xx / 지연, ECS 태스크 수, RDS CPU / 스토리지 / 커넥션)와 자체 호스팅 RUM(v2.16.5, 실제 사용자 브라우저에서 성능을 재는 계층)으로 구성됩니다.

07한계

이 절은 이 구조를 그대로 가져가기 전에 알아야 할 제약을 정리합니다. 다섯 가지 모두 설계가 의도한 트레이드오프이거나 코드에서 확인된 사실입니다.

  • 측정 비용이 실비용입니다. 5분마다 37개 채널 실호출, 12시간마다 패리티 스윕(호출당 max_tokens 256~8,000 상한(기본 256, reasoning 2,048, adaptive_thinking 8,000), caching 피처는 2회 호출), 15분마다 GPT 벤치 80회(8채널 × 10회) 호출이 계속 과금됩니다.
  • 단일 리전 관측입니다. 프로브는 ap-northeast-2의 Fargate에서 나가므로, 다른 리전 사용자의 체감 지연과는 네트워크 경로가 다릅니다.
  • RDS는 t4g.micro Single-AZ입니다. ADR-002가 명시했듯 시계열 데이터 손실을 허용하는 설계이며, 고가용성 요구가 있는 환경에는 그대로 맞지 않습니다.
  • 패리티 판정은 프로브 코드 품질에 종속됩니다. 4.1절의 false-Broken 사례처럼 프로브 결함이 매트릭스를 오염시킬 수 있어, Broken 셀은 증거 확인이 전제입니다.
  • 문서 동기화가 완전하지 않습니다. README의 "6 routes", architecture.md의 스케줄 3개 기술처럼 서술이 코드보다 늦은 지점이 있어, 수치는 코드에서 재확인해야 합니다.

08결론

마지막으로 이 프로젝트에서 가져갈 수 있는 것을 정리합니다. 한 문장으로 요약하면, 이 플랫폼은 37개 LLM 채널을 같은 조건으로 계속 호출해서 속도, 비용, 기능 지원을 데이터로 증명하는 시스템입니다.

이 프로젝트가 보여주는 것은 LLM 관측을 애플리케이션 로그 수집이 아니라 능동 프로빙 문제로 정의한 설계입니다. 측정기를 서비스 프로세스에서 떼어내 EventBridge + 일회성 Fargate 태스크로 만들었습니다. 채널 라벨 규약("Bedrock / Anthropic / OpenAI family (channel)")으로 37개 채널을 한 좌표계에 올리고, 기능 지원 여부는 실행 증거로만 판정합니다.

비슷한 플랫폼을 만들려는 팀이 가져갈 순서는 다음과 같습니다. 1순위는 측정과 조회의 분리(스케줄러 → 일회성 태스크 → DB)입니다. 이것이 없으면 프로버 장애가 대시보드 장애가 됩니다.

2순위는 워크로드 프리셋 라운드로빈입니다. 단일 프롬프트 측정이 만드는 착시를 줄입니다. 3순위가 패리티 스윕인데, 실행 증거 판정과 skipped / unsupported 구분 없이 만들면 매트릭스가 신뢰를 잃습니다.

운영 함정(immutable tag, Scheduler IAM wildcard)은 이 저장소의 ADR을 먼저 읽는 것으로 상당 부분 피할 수 있습니다.
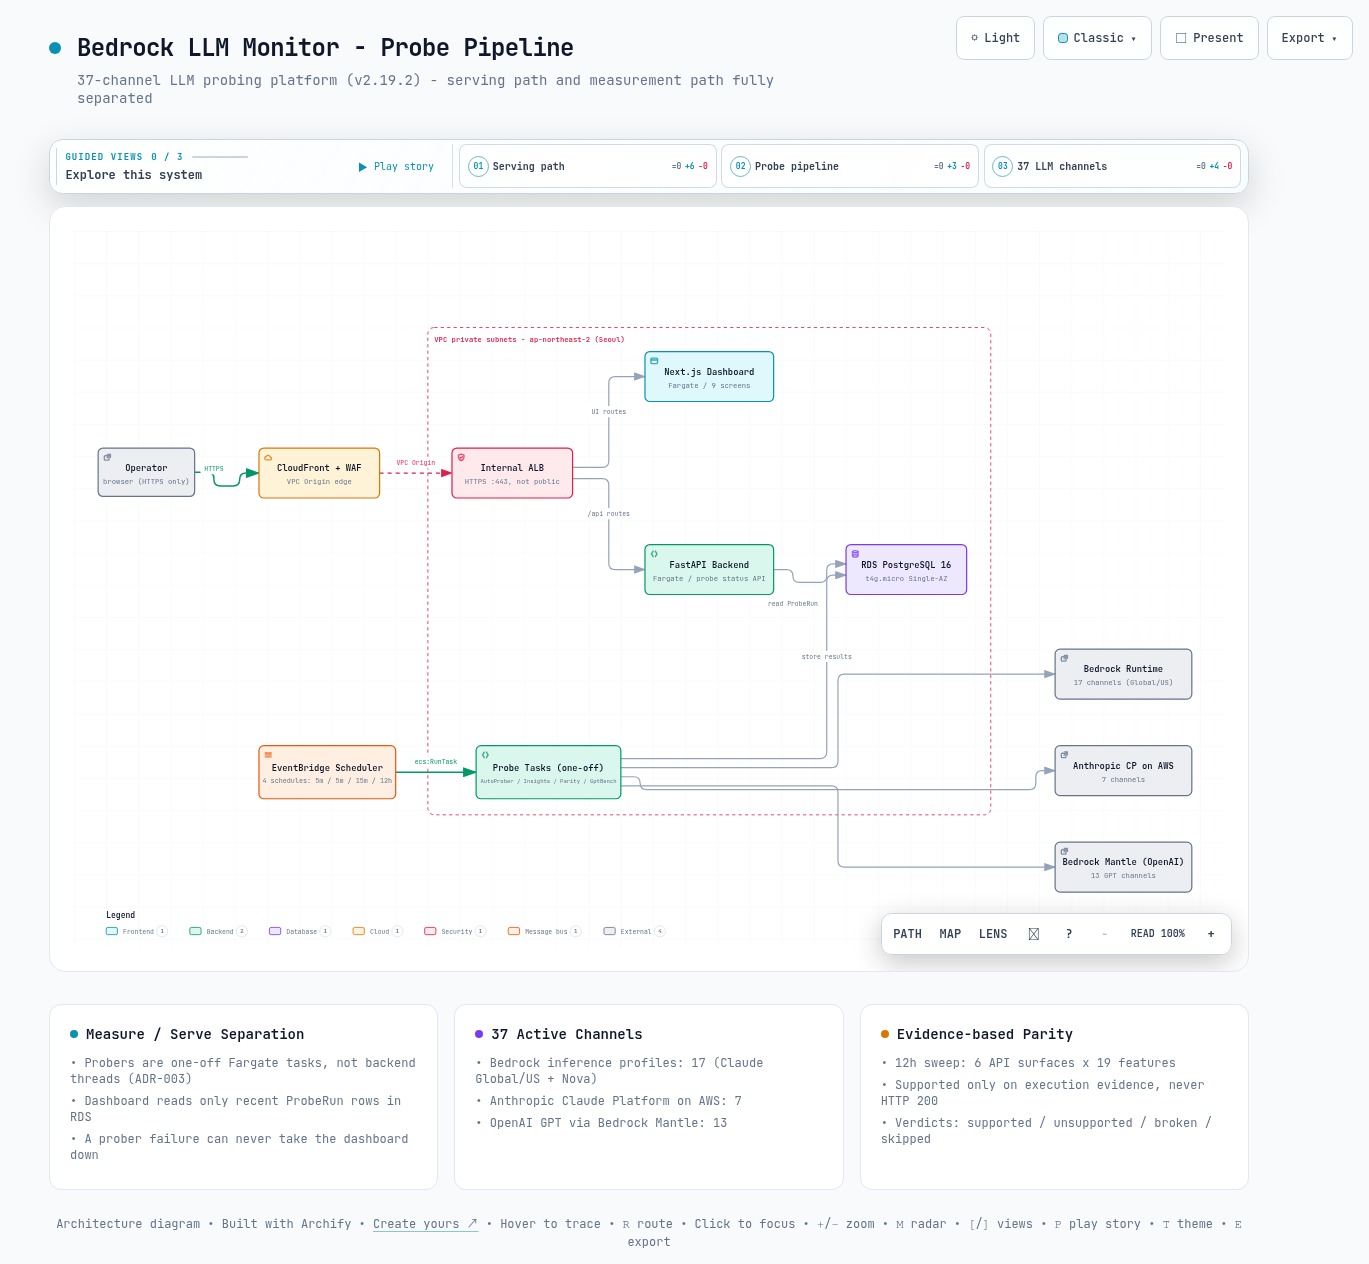
인터랙티브 아키텍처 맵 전체 이미지 - 시스템 구성 요소와 흐름을 한 화면으로 보여줍니다
그림 2. 인터랙티브 아키텍처 맵 전체 보기. 이미지를 클릭하면 노드 탐색, 경로 추적, 다크/라이트 테마를 지원하는 인터랙티브 버전 ↗이 열립니다.

--참고 자료

핵심 출처

  • whchoi98/model-monitoring - 분석 대상 저장소, v2.19.2 (2026-08-01). README, docs/architecture.md, docs/decisions/ADR-001~024, CHANGELOG.md https://github.com/whchoi98/model-monitoring

공식 문서

Observability / Platform Deep Dive

Amazon Bedrock LLM Monitor - Architecture Analysis of an Always-On Measurement Platform for 37 LLM Channels

The same model becomes faster, cheaper, or less capable depending on which path you call it through. This is a code-level analysis of the model-monitoring project (v2.19.2) - its probe pipeline, parity sweep mechanism, and operations - which compares Bedrock inference profiles, Anthropic Claude Platform on AWS, and OpenAI GPT via Bedrock Mantle on a single screen.

Written as of 2026-08-09.

The subject of this analysis is the model-monitoring repository at v2.19.2, per frontend/src/lib/version.ts.

The core catalog definitions are backend/prober.py:AVAILABLE_MODELS and backend/parity/catalog.py.

Primary sources are the GitHub repository whchoi98/model-monitoring plus docs/architecture.md and ADR-001 through ADR-024 in the repository.

TL;DR

01Problem definition - what is measured and why

This section lays out the problem the project tries to solve. The core question is why the same model has to be called through several paths and measured continuously.

Even the same Claude model becomes a different service depending on the invocation path. There are four paths: Bedrock Global inference profiles (global.*), Bedrock US profiles (us.*), Anthropic Claude Platform on AWS (an endpoint hosted by the vendor itself), and OpenAI GPT via Bedrock Mantle. An inference profile is a Bedrock invocation path that spreads requests across multiple regions.

Each path differs in TTFT (the time until the first token arrives after a request), throughput, pricing, and supported features. Those differences keep shifting with regional conditions and model versions. That is why an operator deciding "which channel should carry this workload" needs parallel measurement under identical conditions - the project's starting premise.

The second problem is the feature support matrix. Provider documentation does not spell out every per-channel difference in whether a model supports tool use (the model calling external tools), caching (storing repeated input for reuse), or structured output (forcing answers into a fixed JSON shape). Parameters are also sometimes silently ignored.

ADR-021 (an architecture decision record in the repository) notes that the manual screenshot-proof approach used through v2.10.0 became unsustainable as the catalog grew. That is why a parity run was added that proves support by actually executing it on a schedule.

So how many channels are measured? The number was adjusted from 42 to 37 in v2.19.1. The OpenAI 1P direct path (Path 5, 5 channels) was hidden from the screens by user decision. The code and DB rows were preserved, and only the exposure was turned off via a triple switch (CDK ENABLE_OPENAI_1P=false, the backend visibility.py query filter, and the frontend EXCLUDED_FAMILIES).

What to look for in the table below is how the 37 channels split across the delivery paths.

Table 1. The 37 active channels (per backend/prober.py and comments in frontend TrendChart.tsx)
Channel groupChannelsComposition
Bedrock inference profiles1716 Global/US profiles across 8 Claude models + 1 Nova 2.0 Lite (US)
Anthropic CP on AWS7Fable 5, Opus 5/4.8/4.7, Sonnet 5/4.6, Haiku 4.5 - auto-discovered at startup via /v1/models
OpenAI via Bedrock Mantle13GPT 5.4 (3 regions), 5.5 (2 regions), 5.6 Sol (2) / Terra (3) / Luna (3 regions)
OpenAI 1P direct5 (dormant)Hidden since v2.19.1 - code/DB preserved, registration skipped

02Architecture - the probe pipeline and 8 CDK stacks

This section covers how the system is put together. The key point is that the part that measures and the part that displays are completely separate.

2.1 The serving path

The path a user takes to open the dashboard is: CloudFront VPC Origin → internal ALB (HTTPS:443) → two ECS Fargate services (FastAPI backend, Next.js standalone frontend) → RDS PostgreSQL 16 (t4g.micro, Single-AZ). Fargate is an AWS service that runs containers without you managing servers.

Wrapping the ALB behind a CloudFront VPC Origin instead of exposing it to the internet is the decision of ADR-001. All external ingress is HTTPS-only. The deployment region is ap-northeast-2 (Seoul).

2.2 The measurement pipeline

The measurement pipeline is completely separated from the serving path. In v1 the auto-prober was a daemon thread inside the backend process. In v2, EventBridge Scheduler (an AWS scheduler that runs jobs at fixed intervals) launches a one-shot Fargate task via RunTask on each period (ADR-003).

The code follows this separation. The backend's auto_prober.py exports only the run_cycle() function, and auto_prober_runner.py owns the CLI entrypoint (--once). The probe status API also uses the most recent ProbeRun row in the DB as the source of truth (the single authoritative record) rather than in-process state.

flowchart LR EB["EventBridge Scheduler"] -->|"rate 5 min"| AP["AutoProber Task"] EB -->|"rate 5 min"| IN["Insights Task"] EB -->|"rate 12 h"| PR["ParityRun Task"] EB -->|"rate 15 min"| GB["GptBench Task"] AP --> CH["Probe 37 channels"] CH --> B["Bedrock Runtime"] CH --> A["Anthropic CP on AWS"] CH --> M["Bedrock Mantle OpenAI"] AP --> DB[("RDS PostgreSQL 16")] IN --> DB PR --> DB GB --> DB DB --> BE["FastAPI backend"] BE --> FE["Next.js dashboard"]
Figure 1. The probe pipeline. EventBridge Scheduler runs four kinds of one-shot Fargate tasks on schedule, and the dashboard only reads the DB the tasks populate. The separation of measurement and reads is the core of this design.

What to look for in the table below is the cadence of the four schedules and the job each task owns.

Table 2. The four EventBridge schedules (per cdk/lib/stacks/scheduler-stack.ts)
ScheduleRateTask commandRole
AutoProberSchedulerate(5 minutes)python -m auto_prober_runner --onceProbes 37 channels × 1 workload category
InsightsSchedulerate(5 minutes)python -m insights_runner --window 6hGenerates a summary of the last 6 hours with Sonnet 4.6
ParityRunSchedulerate(12 hours)python -m parity_runner --onceExecution-evidence sweep across model × surface × feature
GptBenchSchedulerate(15 minutes)python -m gptbench_runner --onceTTFB/TTFT bench: 8 Mantle GPT channels × 10 calls
Note - where docs and code disagree, this document follows the code

docs/architecture.md describes three EventBridge schedules. However, scheduler-stack.ts defines four, including GptBench added in v2.18.0.

Also, config.yaml at the repository root (4 models, SQLite, us-east-1) is a v1 leftover that no current backend / CDK code references. The actual probe cadence is determined by the EventBridge schedule definitions, not by config.

2.3 The 8 infrastructure stacks

How many units is the infrastructure managed as? Eight CDK v2 TypeScript stacks, deployed in dependency order: Network (VPC, NAT GW, 9+1 PrivateLink endpoints), Data (RDS, Secrets, SSM), Cluster (ECS cluster, ECR), AgentCore (chatbot memory), AppServices (2 Fargate services, ALB), Edge (CloudFront, WAF), Scheduler (schedules and task definitions), and Observability (7 alarms, dashboard, SNS).

Reusable L3 constructs (fargate-service.ts, pinned-image.ts) share the service definitions.

03Metrics and workload presets

This section covers what a single measurement records and under what conditions. A model's score depends on what kind of work you give it, so the kinds of work are defined first.

A single probe cycle applies one workload category to all 37 channels. There are six categories, rotated round-robin (picked in a fixed repeating order) per cycle. So the same category is measured again every 30 minutes (5 min × 6).

The definitions live in WORKLOAD_PRESETS in backend/auto_prober.py as the source of truth. Each result row carries a probe_results.category column, enabling per-category filtering.

What to look for in the table below is which usage pattern each of the six categories imitates.

Table 3. The six workload categories (backend/auto_prober.py WORKLOAD_PRESETS)
idLabelMeasurement intent
chat-shortShort chatShort responses, TTFT-sensitive
reasoningReasoningComplex reasoning, large max_tokens
code-genCode generationCode output quality and throughput
summarizeSummarizationLong input → short output
structuredJSON extractionText → JSON-only extraction
translateTranslationEN-KO technical translation, nuance preservation

How many things are recorded per call? Six: TTFT (request → first token, ms), Total Latency (request → last token, client-side, ms), Server Latency (Bedrock-reported internal processing time excluding network overhead, ms), TPS (output throughput after the first token, tok/s), input/output token counts, and stop reason (why the model stopped generating - an enum such as end_turn / max_tokens / tool_use).

Token counts combine with the per-model price table in backend/pricing.py. That is the input to the 30-day cost projection.

Principle: keeping latency metrics split into client-side observations (TTFT / Total) and server-reported values (Server Latency) lets the data tell whether inter-channel differences come from the network path or from model processing.

04Parity sweep deep dive - execution-evidence verdicts

This section covers how the platform proves that "this channel supports this feature". The starting point is that a successful call alone does not prove support.

The design question for the parity run was "what counts as proof of support". ADR-021's answer is that HTTP 200 is insufficient as a verdict basis. Parameters are often silently ignored, and a request can succeed while the feature does not actually work.

So the backend/parity/ package calls the real API and marks a feature as supported only when the response passes an evidence check of its content.

4.1 Matrix size and evidence checks

How wide is the sweep? Model × 6 API surfaces × 19 features. An API surface is one of the kinds of API through which the same model can be called.

The surfaces are converse, invoke_model, messages, messages_mantle, chat_completions, and responses (catalog.py:SURFACES). The 19 features are basic / streaming / system_instructions / tool_use / structured_output / reasoning / caching / adaptive_thinking / count_tokens / batches / web_search / computer_use / reasoning_effort / json_schema / url_sources / memory_tool / code_execution / files_api / models_api.

The initial ADR-021 design was 5 surfaces × 7 features. It reached the current size through ADR-022 (the Mantle Messages surface) and ADR-023 (the 19-feature expansion).

There are five evidence checks. A canary here is a check technique that plants a marker and looks for it in the response.

  • Tool canary round-trip - sends a tool definition and verifies the model actually calls that tool.
  • System instruction canary - verifies that a marker planted in the system prompt is reflected in the response.
  • JSON parsing + required keys - checks that structured output is valid JSON and contains the requested keys.
  • Cached-token count - proves caching works when the cached-token count is greater than 0 on repeated requests.
  • Two or more stream deltas - verifies that streaming actually arrives in incremental chunks.

The verdict logic is isolated as pure functions in engine.py and is unit-tested. Results take one of four values: supported / unsupported / broken / skipped.

If the provider returns a "clean unsupported rejection" signature (unsupported_parameter etc.) the verdict is unsupported. Other errors or evidence failures are broken, and not-applicable cases (such as the reasoning feature on a non-reasoning model) are skipped. Distinguishing skipped from unsupported is what ADR-023 calls "honest exclusion".

Each run stores the verdicts along with evidence JSON, latency, and errors in the parity_runs / parity_results tables. Clicking a cell on the /parity screen opens an evidence modal with the raw material.

Caution - a Broken verdict may be a probe defect

An incident ADR-021 records about itself: on the first run, max_tokens=64 truncation turned every structured_output check into a false Broken. It was fixed in v2.11.1 with per-feature token budgets (max_tokens_for).

Before trusting a Broken cell, check the response_snippet in the evidence to determine whether the defect is in the probe or the model.

4.2 What multi-channel comparison actually found

Running the same checks per channel reveals gaps the documentation does not mention. ADR-021 records three measured findings: the Mantle ChatCompletions surface being entirely unsupported (only the Responses API works), GPT 5.4 not reporting reasoning_tokens, and per-surface differences in Claude Fable 5 caching.

What about cost? The catalog reflects that the GPT 5.6 generation has Bedrock in-region price parity with OpenAI 1P, while 5.4 / 5.5 carry a 10% markup.

05The 9 analysis screens

This section covers the screens for reading the accumulated data. Nine pages, split by purpose, make up one dashboard.

The frontend is Next.js 14 standalone, and a shared header (AppHeader.tsx) ties the 9 pages together. The project-structure section of the README still says "6 routes", but the actual src/app/ holds 10 routes (9 directories) including the root (/) and the chatbot-only /chat. Of those, 9 are analysis screens.

What to look for in the table below is each screen's path and the question that screen answers.

Table 4. The 9 analysis pages (per frontend/src/app/ routes)
PathScreenWhat it shows
/DashboardProbe status + 37 model cards + latency/TPS trends, workload filter
/modelsModel ExplorerPer-model cards + Converse/InvokeModel/Messages/Responses code examples
/parityParity RunModel × surface × feature matrix + evidence modal + manual trigger
/gpt-on-awsGPT on AWSTTFB/TTFT/GAP bench across 8 Mantle GPT channels, 15-minute cadence
/costCost30-day cost projection + per-model/per-channel comparison
/reliabilityReliabilitySuccess rate by family/channel + error buckets
/efficiencyEfficiencyCategory-weighted 0-100 token efficiency score
/analysisAnalysisStop reason distribution + output length histograms
/promptsPromptsPrompt set CRUD + Bedrock OptimizePrompt (auth required)

Beyond the screens there is a chatbot built on Claude Sonnet 4.6. It answers natural-language questions by querying the time-series store through 4 custom tools. Conversation context is retained in AgentCore Memory for 30 days.

The bench on the GPT on AWS page uses a separate methodology. A fixed cached prompt of about 55.8k tokens is called 10 times sequentially per channel. It aggregates TTFB (the time to the first stream event), TTFT (first text delta), and GAP (their difference, a thinking approximation) as median / p95.

06Operations in practice

This section covers how the platform is actually deployed and run. The incidents the repository hit and the responses are recorded together, so they can be used to avoid the same traps.

6.1 Deployment procedure

Deployment is governed by the runbook (docs/runbooks/deploy.md). First, make verify (CDK lint + typecheck + 71 Jest tests + cdk-nag + ruff + 91 pytest tests + frontend tsc) must pass.

Then an arm64 container image is built with an immutable tag (a tag whose content never changes once assigned, v<timestamp>) and pushed to ECR. The image URI is passed to CDK deploy pinned all the way down to @sha256:<digest>. The frontend image requires RUM-related --build-arg values at build time.

Caution - the :latest tag combined with the ECS image cache

An incident this repository actually hit and recorded as ADR-010 / ADR-018. Pushing as :latest lets Docker layer dedupe and the ECS image cache combine so that a deployment looks successful while the new code was never picked up.

The response was immutable tags + digest pinning. A repository whose cache was already poisoned was worked around by renaming it (bedrock-monitor-backend-v2).

6.2 Silent failures of scheduled jobs

Silent failures of scheduled jobs are runbooked as well. The ecs:RunTask Resource in the EventBridge Scheduler role must be a :* wildcard on the task definition family (ADR-011). Pinning a revision number causes a permission denial after the next revision is deployed, and the job silently fails - it just stops running with no error shown.

Empty EventBridge metrics then make it hard to debug. There are two diagnostic markers: last_run_time in /api/auto-probe/status being hours old, or the /ecs/autoprober log group having no entries within 5 minutes.

6.3 Data lifecycle and observability

Data lifecycle is handled by retention.py. Raw probe_results older than RETENTION_DAYS (default 60 days) are migrated into hourly aggregate tables.

DB migrations run at backend startup in the lifespan. They hold pg_advisory_lock with a 30-second statement_timeout and use only ADD COLUMN IF NOT EXISTS. So they stay idempotent (safe to run more than once) even when multiple tasks start concurrently.

The observability layer consists of 7 CloudWatch alarms (ALB 5xx / latency, ECS task count, RDS CPU / storage / connections) and self-hosted RUM (v2.16.5, a layer that measures performance in real users' browsers).

07Limitations

This section lists the constraints to know before adopting this structure as-is. All five are either trade-offs the design intended or facts verified in the code.

  • Measurement cost is real spend. Real calls to 37 channels every 5 minutes, a parity sweep every 12 hours (max_tokens capped at 256~8,000 per call (default 256, reasoning 2,048, adaptive_thinking 8,000); the caching feature makes 2 calls), and 80 GPT bench calls (8 channels × 10) every 15 minutes keep accruing charges.
  • It is single-region observation. Probes originate from Fargate in ap-northeast-2, so the network path differs from the latency perceived by users in other regions.
  • RDS is t4g.micro Single-AZ. As ADR-002 states, the design tolerates time-series data loss and does not fit environments with high-availability requirements as-is.
  • Parity verdicts depend on probe code quality. As the false-Broken case in section 4.1 shows, a probe defect can pollute the matrix, so a Broken cell requires evidence review first.
  • Documentation sync is incomplete. Prose lags the code in places, such as the README's "6 routes" and architecture.md describing 3 schedules, so numbers should be re-verified against the code.

08Conclusion

Finally, here is what you can take away from this project. In one sentence, this platform keeps calling 37 LLM channels under identical conditions and proves speed, cost, and feature support with data.

What this project demonstrates is a design that frames LLM observability as an active probing problem rather than application log collection. It detaches the measuring instrument from the serving process into EventBridge + one-shot Fargate tasks. It puts 37 channels onto one coordinate system with a channel label convention ("Bedrock / Anthropic / OpenAI family (channel)") and judges feature support only by execution evidence.

For a team building a similar platform, the order of adoption is as follows. First comes the separation of measurement and reads (scheduler → one-shot task → DB). Without it, a prober failure becomes a dashboard failure.

Second is workload preset round-robin. It reduces the illusion created by single-prompt measurement. Third is the parity sweep - built without execution-evidence verdicts and the skipped / unsupported distinction, the matrix loses trust.

The operational traps (immutable tags, the Scheduler IAM wildcard) can largely be avoided by reading this repository's ADRs first.

Full image of the interactive architecture map showing the system components and flows in one view
Figure 2. Full view of the interactive architecture map. Click the image to open the interactive version ↗ with node search, route tracing, and dark/light themes.

--References

Primary source

  • whchoi98/model-monitoring - the analyzed repository, v2.19.2 (2026-08-01). README, docs/architecture.md, docs/decisions/ADR-001 through ADR-024, CHANGELOG.md https://github.com/whchoi98/model-monitoring

Official documentation